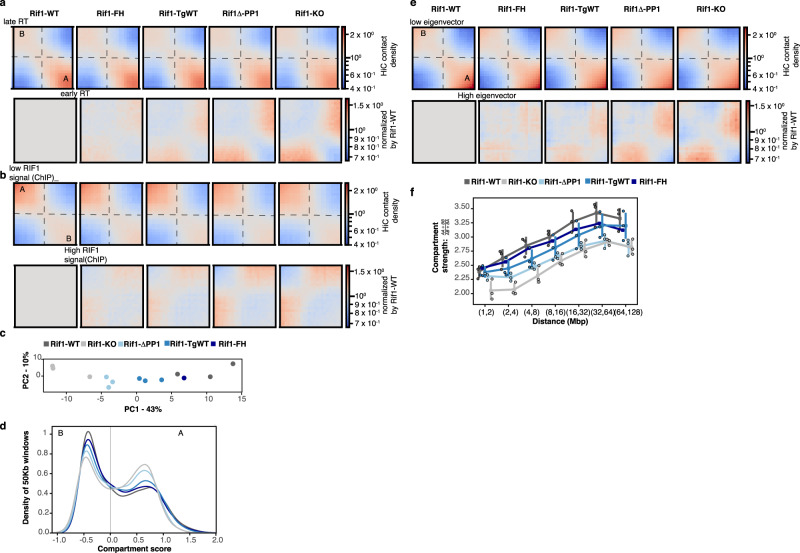
Fig. 4. Segregation of A and B nuclear compartments is sensitive to RIF1 dosage.
a Top row: Saddle plot of Hi-C data, binned at 250 kb resolution for loci ranked by their replication timing. An increase in contacts of genomic positions of opposite replication timings is progressively more evident from Rif1-WT to Rif1-KO. The triplicates for each genotype (except for Rif1-FH) were combined. Lower row: Hi-C for each genotype, data normalised to Rif1-WT. Red indicates a gain in contacts. A and B indicates the compartments. b Top row: Saddle plot of Hi-C data, binned at 250 kb resolution for loci ranked by their association with RIF113. An increase in contacts between RIF1-associated and RIF1-devoided genomic positions is progressively more evident from Rif1-WT to Rif1-KO. The triplicates for each genotype (except for Rif1-FH) were combined. Lower row: Hi-C for each genotype, data normalised to Rif1-WT. Red indicates a gain in contacts. A and B indicate the compartments. c Principle component analysis of A/B compartmentalisation for the indicated genotypes in triplicate, except for Rif1-FH. d Distribution of genomic regions of 250 kb windows between the A and B compartment. Mean of three biological replicates is shown, except for the parental line Rif1-FH. e Top row: Saddle plot of Hi-C data, binned at 250 kb resolution for loci ranked by their eigenvector values. An increase in contacts between genomic positions in different compartments is progressively more evident from Rif1-WT to Rif1-KO. The triplicates for each genotype (except for Rif1-FH) were combined. Lower row: Hi-C for each genotype, data normalised by Rif1-WT. Red indicates a gain in contacts. A and B indicates the compartments, calculated from our data. f Compartment strength variation with distance for the indicated genotypes. Individual values for the three biological replicates are represented by the outlined circles, except for Rif1-FH. The line represents the median and the bars the standard deviations.

