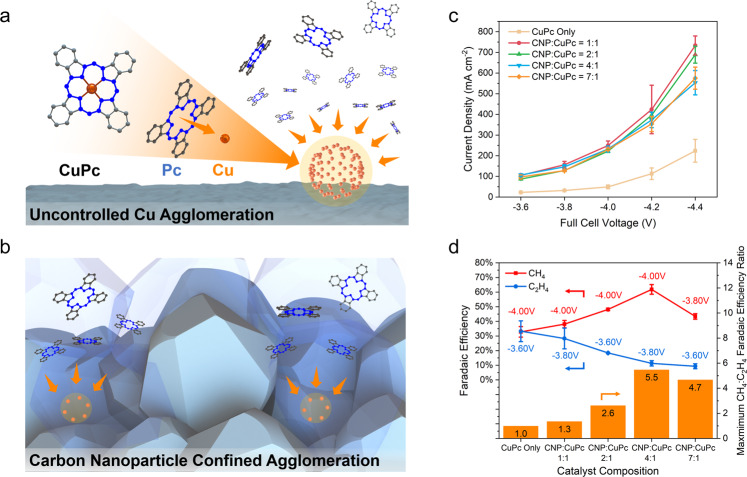
Fig. 2. Effect of the CNP to CuPc ratio on CO2RR methanation performance.
Schematic of the atomic agglomeration (marked with orange arrows) from CuPc reduction a without CNP and b with CNP. c Current-voltage characteristics for samples with different CNP to CuPc ratios. d The maximum FE toward CH4 and C2H4 for samples with different CNP to CuPc ratios when operating between full cell voltages of −3.6 and −4.4 V. Error bars represent the standard deviation of three independent measurements.

