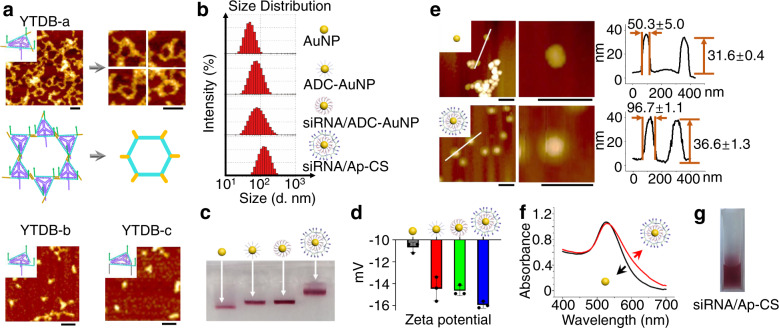
Fig. 2. Characterization of siRNA/Ap-CS Nanostructure.
a AFM images of three Y-shaped backbone-rigidified triangular DNA brick (YTDB-a, YTDB-b, and YTDB-c). Inset: magnified AFM images of YTDB-a. Scare bar is 50 nm. b Dynamic light scattering (DLS) analysis and c agarose gel electrophoresis to confirm the stepwise assembly of siRNA/Ap-CS. The red bands indicate the naked or DNA functionalized AuNPs. These experiments were conducted three times independently with similar results. d Zeta potential analysis of four nanostructures in panel c mentioned by DLS. The error bar represents the standard deviation (SD). The measured data are expressed as the means ± SD (n = 3). e AFM images of naked-AuNPs and siRNA/Ap-CS. Middle panel: expanded view of a typical CS nanoparticle. Scare bar is 150 nm. Right panel: cross-section profiles of naked-AuNPs and siRNA/Ap-CS taken along the white line in the left AFM images. f UV−vis absorption spectrum of naked-AuNPs (black line) and siRNA/Ap-CS (red line). g Photographed image of siRNA/Ap-CS solution.

