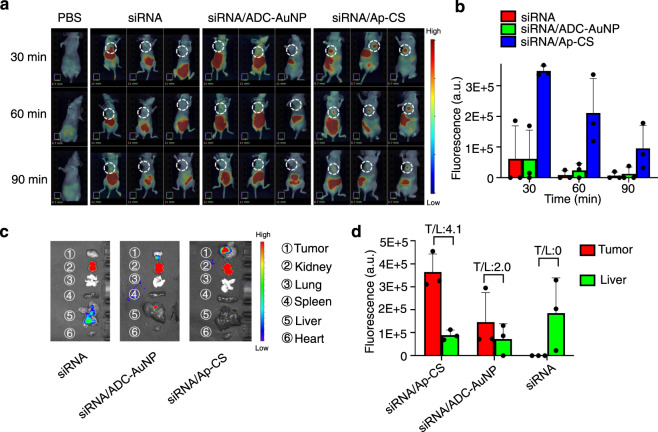
Fig. 4. In vivo biodistribution of siRNA/Ap-CS formulation.
a Time-dependent in vivo fluorescence imaging to explore the whole-body biodistribution kinetics of siRNA/Ap-CS and its tumor localization. A549 tumor-bearing BALB/c nude mice were used, and the samples, including PBS, siRNA, siRNA/ADC-AuNP, and siRNA/Ap-CS, were administrated to the mice via tail vein injection. b The fluorescence intensity of tumor sites in the white circles in panel a. The error bar represents the standard deviation (SD). The measured data are expressed as the means ± SD (n = 3). c Fluorescence images of the organs harvested at 90-min post injection of siRNA/Ap-CS, accompanied by the quantitative assessment of fluorescence intensity from liver and tumor (d) where the fluorescence ratio of tumor-to-liver (T/L) is also presented. The PS-ADC (Plk1 sense partly complementary to ADC) and PA-Cy5 (Cy5-labeled Plk1 antisense) were used for the preparation of siPlk1 duplex. The error bar represents the standard deviation (SD). The measured data are expressed as the means ± SD (n = 3).

