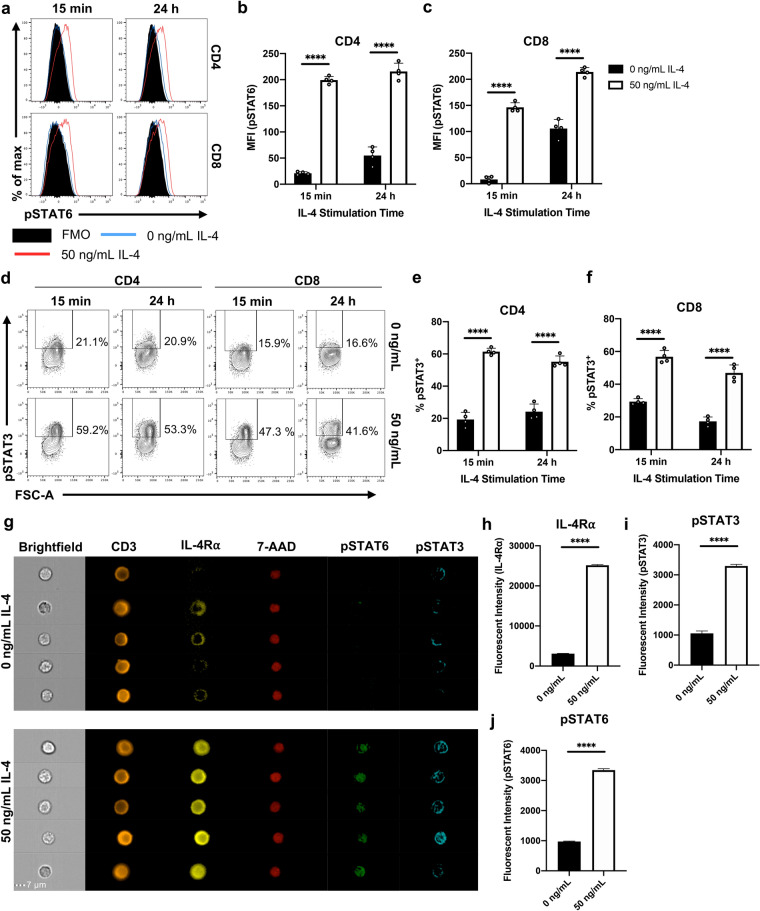
Figure 3.
IL-4 stimulation promotes phosphorylation of both STAT6 and STAT3 on T cells. Whole spleen homogenate derived from naïve 6–8-week-old female BALB/c mice (n = 4) were stimulated with 50 ng/mL IL-4 in vitro for 15 min or 24 h prior to flow cytometric analysis. (a) Representative histograms show the expression of pSTAT6. MFI (pSTAT6) of both (b) CD4 and (c) CD8 T cells between treatment conditions. (d) Representative contour plots showing the expression of pSTAT3; since pSTAT3 expression was bimodal, MFI was not evaluated. The proportion of (e) CD4 and (g) CD8 T cells that were deemed pSTAT3+. Data are represented as mean + SD, with dots representing biological replicates from a single experiment. The experiments were repeated three times. Two-way ANOVA combined with Tukey’s post-hoc multiple comparison test was conducted to compare groups. (g) Whole spleen homogenate derived from naïve 6–8-week-old female BALB/c mice were stimulated with 50 ng/mL IL-4 in vitro for 24 h prior to ImageStream analysis. Representative images of pre-gated total T cells. Note that cells were fixed, allowing 7-AAD to be used as a nuclear stain. The fluorescent intensity of (h) IL-4Ra, (i) pSTAT6 and (j) pSTAT3 were compared between treatment groups. Data are represented as mean + SEM, where n > 1200 from a single experiment. The experiment was repeated three times. Student’s t-tests were conducted to compare groups. p-value denotation: ‘****’p < 0.0001.

