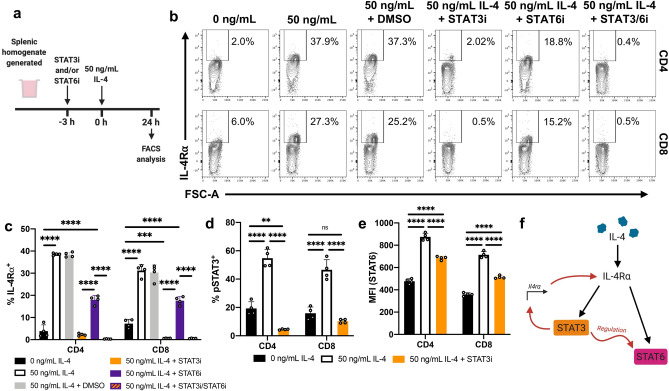
Figure 5.
STAT3 regulates IL-4R⍺ expression to affect downstream STAT6 activation. (a) Whole spleen homogenate derived from naïve 6–8-week-old female BALB/c mice (n = 4) were pre-incubated with STAT3i and/or STAT6i in vitro for 3 h prior to stimulation with 50 ng/mL IL-4 for 24 h prior to flow cytometric analysis. (b) The percentage of CD4 and CD8 T cells found to be IL-4R⍺+ for each inhibitory/stimulatory group. (c) Representative contour plots showing the expression of IL-4R⍺. (d) Cells were pre-incubated with STAT3i prior to 24 h IL-4 stimulation. Phosphorylation statuses were subsequently evaluated. The percentage of T cells found to be pSTAT3+. (e) pSTAT6 MFI for each treatment group. Representative plots shown in Sup Fig. 5e–f. (f) Graphical and temporal depiction of the proposed regulatory relationship between STAT3 and STAT6––created using BioRender. Data are represented as mean + SD, where dots represent biological replicates from a single experiment. The experiments were repeated at least twice. Two-way ANOVA combined with Tukey’s post-hoc multiple comparison test was conducted to compare groups. p-value denotations: ‘ns’ p ≥ 0.05, ‘**’p < 0.01, ‘***’p < 0.001 and ‘****’p < 0.0001.

