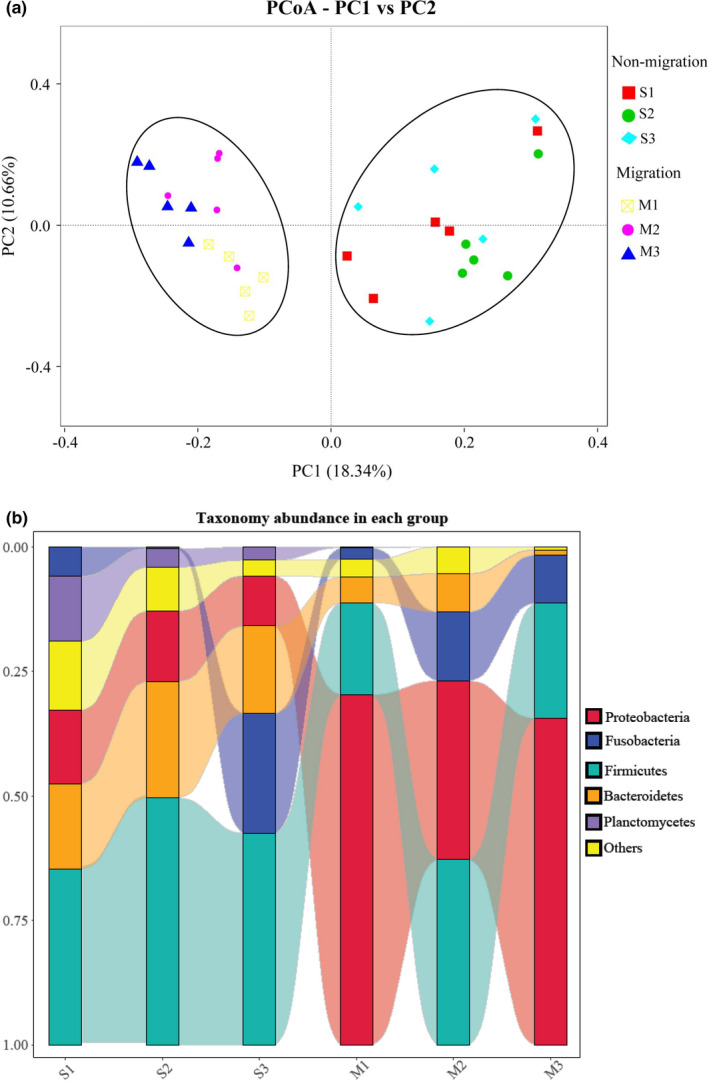
FIGURE 2.

Comparison of the bacterial community in the different group studied of Megalobrama terminalis. (a) Principal coordinates analysis (PCoA) of bacterial community compositions the different group studied of M. terminalis based on the unweighted UniFrac distance matrix. The individual samples are color‐coordinated according to the different group. (b) Dominant gut microbiota composition in the different M. terminalis groups at phylum level. Each bar represents average relative abundance of each bacterial taxon within a group at phylum level
