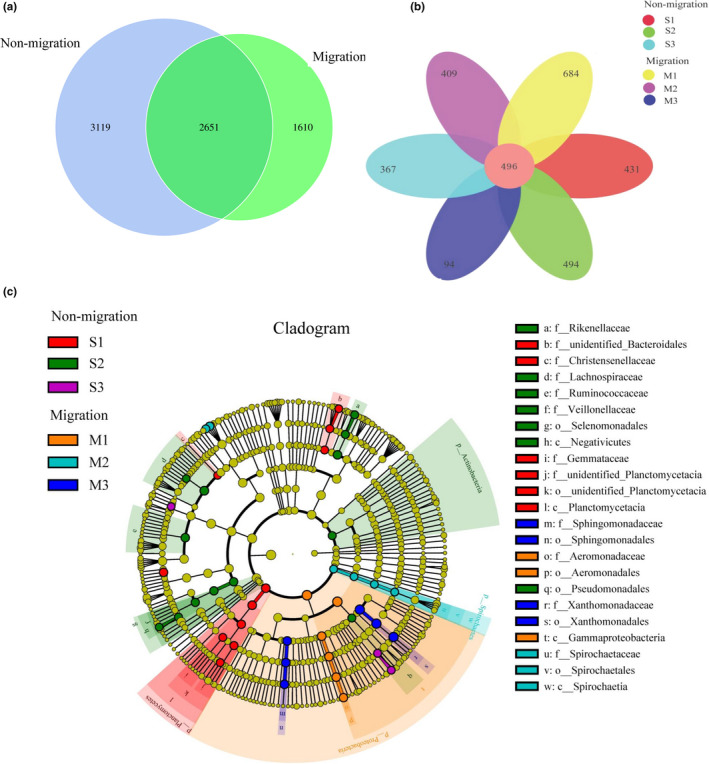
FIGURE 3.

Shared and unique gut microbial populations in the different group studied of Megalobrama terminalis. (a) Venn diagram displays the number of shared and unique OTUs between M. terminalis nonmigration and migration population. (b) Venn diagram displays the number of shared and unique OTUs among six groups distributed in migration channel of M. terminalis. (c) Cladogram indicating LEfSe results presenting the recognized OTUs distributed according to phylogenetic characteristics around the circle. The dots in the center showed the OTUs at phylum level, whereas the outer circle of dots showed the OTUs at species level. The color of the dots and sectors present most abundant OTUs different groups studied of M. terminalis respectively. Yellow color indicates OTUs that showed similar abundance in all compartments. The colored sectors give information on phylum (full name in outermost circle, given only for phylum showing significant difference between groups, class, order, family that were significantly different between groups are showed at the right side of figure)
