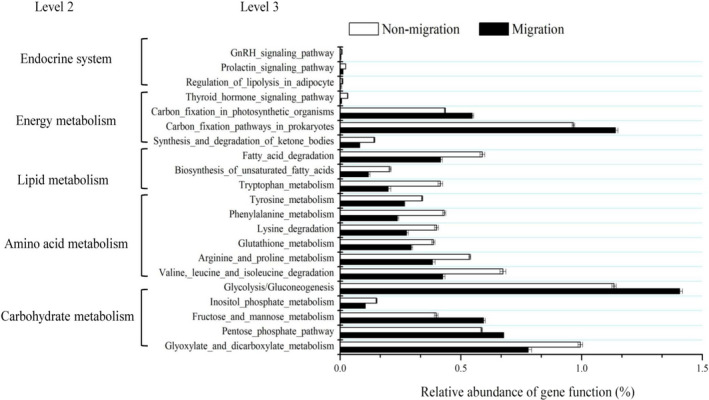
FIGURE 5.

Comparison of the relative abundance of PICRUSt functional analysis of between nonmigrated and migrated Megalobrama terminalis population. Significant differences between nonmigrated and migrated M. terminalis population in gene categories at level 3 (t test, p < .05)
