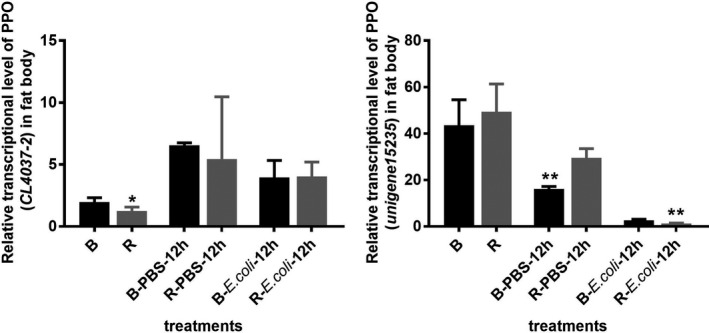
FIGURE 7.

Relative gene expression of PPOs (CL4037‐2 and unigene15235) in the fat body in the two color lines after Escherichia coli challenge. B and R, relative gene expression without injection; B/R‐PBS‐12 hr, relative gene expression at 12 hr after PBS injection; B/R‐E. coli‐12 hr, relative gene expression at 12 hr after E. coli injection. *and ** mean significant difference at the levels of p < .05 and .01 by t test, respectively
