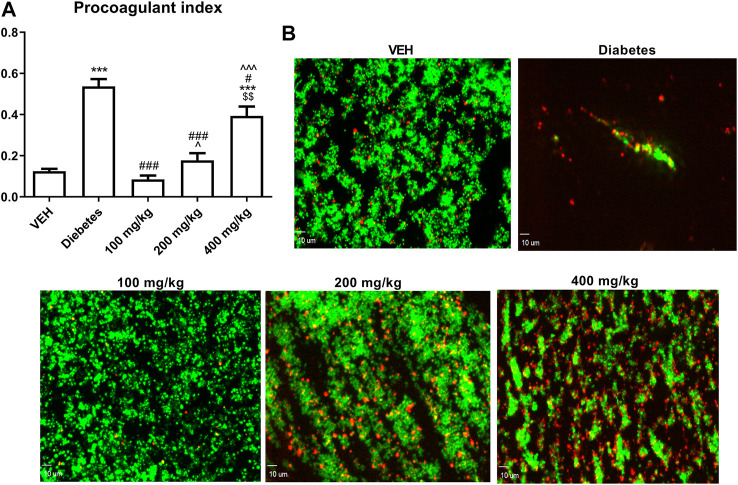
FIGURE 4.
The effect of TE on PI (A). Representative confocal microscopy images of thrombus consisting of PS-negative platelets (green) and PS-positive platelets (red). Bar = 10 µm (B) ***p < 0.001 vs. VEH; #p < 0.05, ###p < 0.001 vs. Diabetes; ^p < 0.05,^^^p < 0.001 vs. 100 mg/kg; $$p < 0.01 vs. 200 mg/kg; n = 8–11. Data are shown as mean ± SEM.

