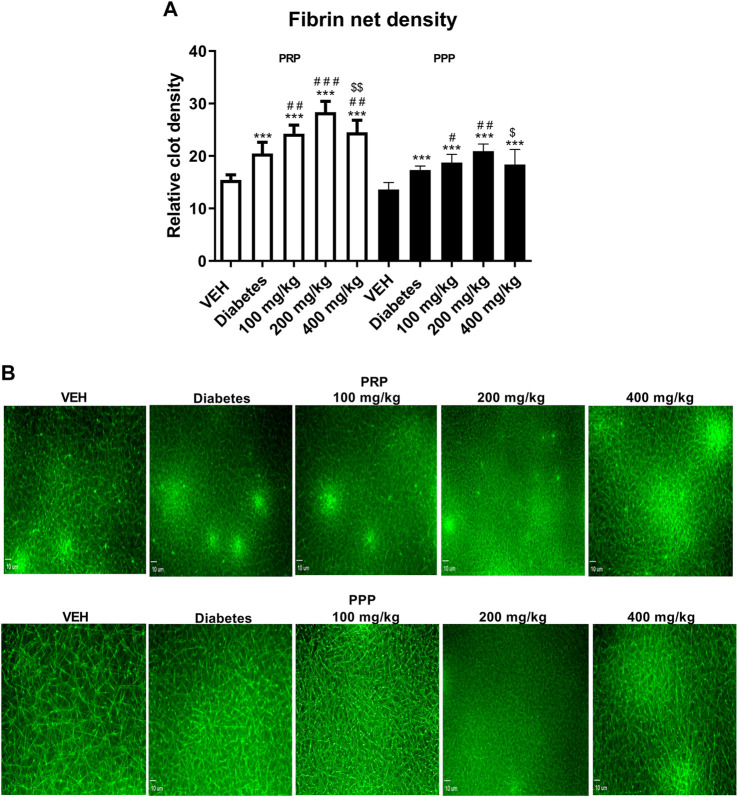
FIGURE 7.
The effect of TE on the fibrin net density in clots formed after recalcination of PRP (white bars) and PPP (black bars) (A). Representative confocal microscopy images of fibrin net. Bar = 10 µm (B). ***p < 0.001 vs. VEH; #p < 0.05, ##p < 0.01, ###p < 0.001 vs. Diabetes; $p < 0.05, $$p < 0.01 vs. 200 mg/kg; n = 7–9. Data are shown as mean ± SEM.

