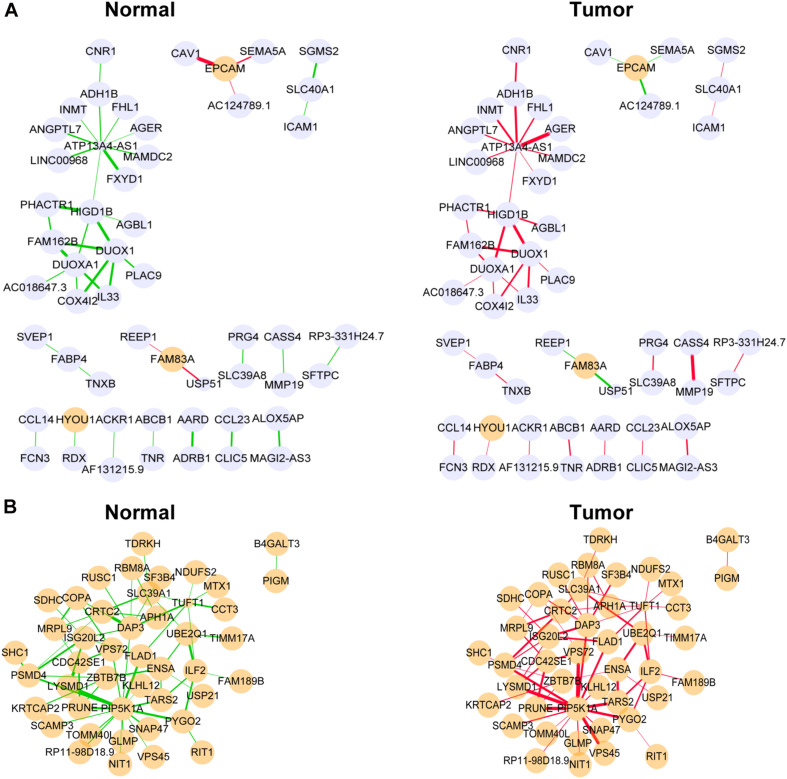
FIGURE 5.
Differentially co-expressed gene networks in the yellow (A) and medium orchid (B) modules from the TCGA dataset. Each node represented a gene, with lavender-filled color denoting downregulation and orange-filled color upregulation. The larger size of node represented smaller adjusted P-value. The edge represented connection between two genes. The green edge represented negative correlation and red positive correlation. The thicker part of the edge represented a stronger correlation coefficient.

