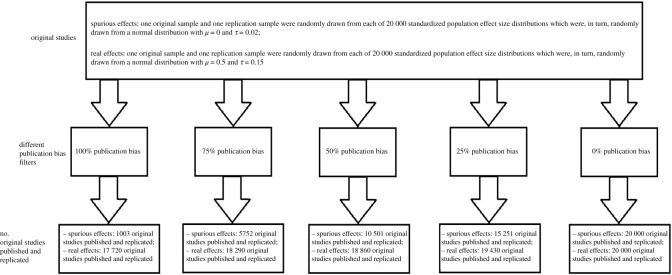
Figure 1.
Operationalization of publication bias. For each of the different values of publication bias (i.e. 100, 75, 50, 25 and 0%), all original studies were selected for which the resulting p-value was less than 0.05 (i.e. published and replicated). As for the original studies with a p-value ≥ 0.05, we included a fraction of them depending on the level of simulated publication bias as follows: 100% publication bias: 0% of the non-significant original studies were selected; 75% publication bias: 25% of the non-significant original studies were selected; 50% publication bias: 50% of the non-significant original studies were selected; 25% publication bias: 75% of the non-significant original studies were selected; 0% publication bias: 100% of the non-significant original studies were selected.

