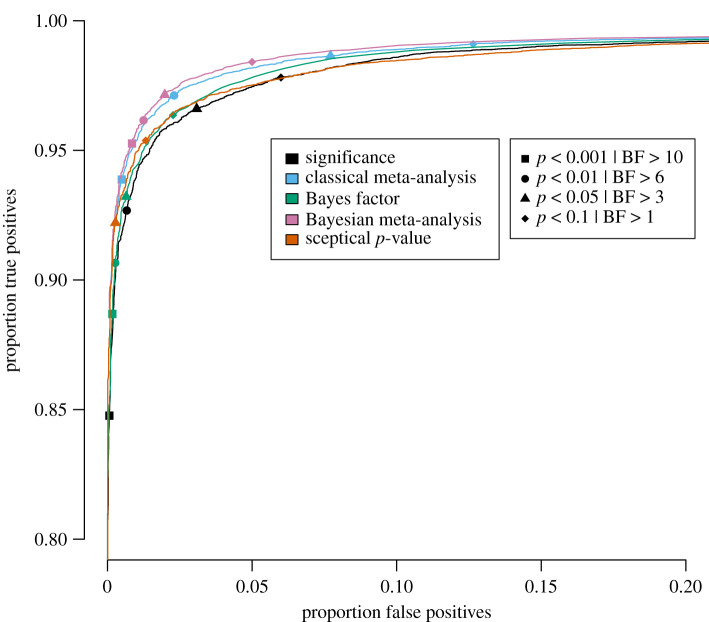
Figure 5.
Proportion of true positives plotted against proportion of false positives for publication bias level of 50%, meaning that 50% of the non-significant original studies were published and replicated. Different replication success metrics are indicated by different colours; different symbols indicate different thresholds of the replication success metrics. Significance thresholds range from 0.0001 (bottom-left) to 0.5 (top-right), BF thresholds range from 200 (bottom-left) to 1/10 (top-right).

