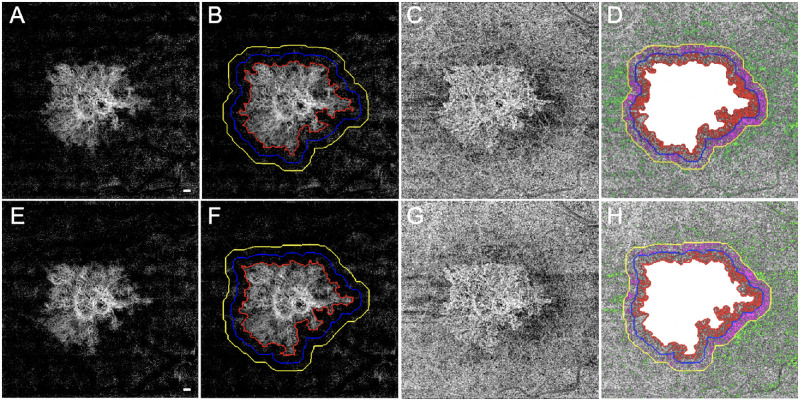
Figure 1.
SS-OCTA 6 × 6-mm scans from an eye that did not develop exudation during the follow-up period. The top row images are from the penultimate visit prior to the last visit before the patient was followed for at least 6 consecutive months without exudation. The bottom row images are from the last visit prior to 6 consecutive months without exudation. The interval between these two visits was 84 days. En face flow images of the MNV at visit 1 (A) and at visit 2 (E). The boundaries of the MNV were outlined in red using an automated algorithm with a size of 5.77 mm2 at visit 1 (B) and 5.74 mm2 at visit 2 (F). In Region 1 (R1), the 1° rim around MNV (blue outline) extends 0 to 300 µm from the margin of the MNV. Region 2 (R2, yellow outline) extends 1° farther out, from 300 to 600 µm away from the MNV margin. The third region (R3) represents the scan area excluding the MNV, R1, and R2. En face CC flow images at visit 1 (C) and at visit 2 (G). (D, H) Global thresholding measurement of CC FDs minus the area of MNV (white). The CC FDs in R1 are color coded in red, the CC FDs in R2 are color coded in purple, and the CC FDs in R3 are color coded in green. At visit 1 (D), CC R1 FD% = 31.66%, CC R2 FD% = 23.52%, CC R3 FD% = 7.72%, and CC FD% excluding MNV = 12.17%. At visit 2 (H), CC R1 FD% = 27.70%, CC R2 FD% = 23.35%, CC R3 FD% = 7.45%, and CC FD% excluding MNV = 11.58%. Scale bar: 300 µm.

