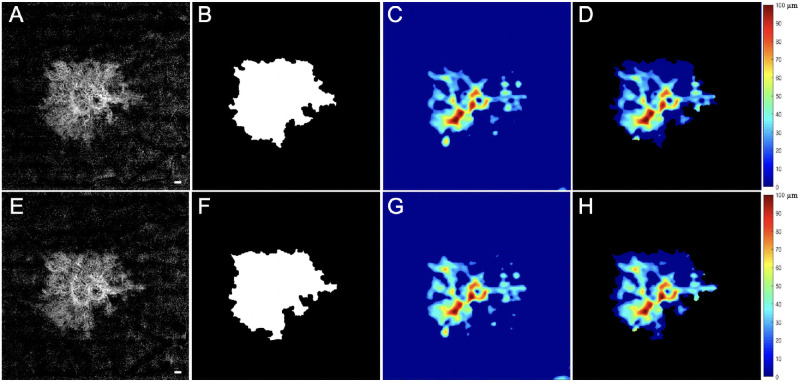
Figure 5.
PED volume results from SS-OCTA 6 × 6-mm scans from the same nonexudative case and the same visits shown in Figure 1. The top row images are from the penultimate visit prior to the last visit before the patient was followed for at least 6 consecutive months without exudation. The bottom row images are from the last visit prior to 6 consecutive months without exudation. The interval between these two visits was 84 days. En face flow images of the MNV at visit 1 (A) and at visit 2 (E). White MNV masks at visit 1 (B) and at visit 2 (F). Total PED volume maps at visit 1 (C) = 0.12 mm3 and at visit 2 (G) = 0.14 mm3. MNV–PED volume maps generated by superimposing the MNV mask (B, F) on the total PED volume maps (C, G) at visit 1 (D) = 0.12 mm3 and at visit 2 (H) = 0.13 mm3. Scale bar: 300 µm.

