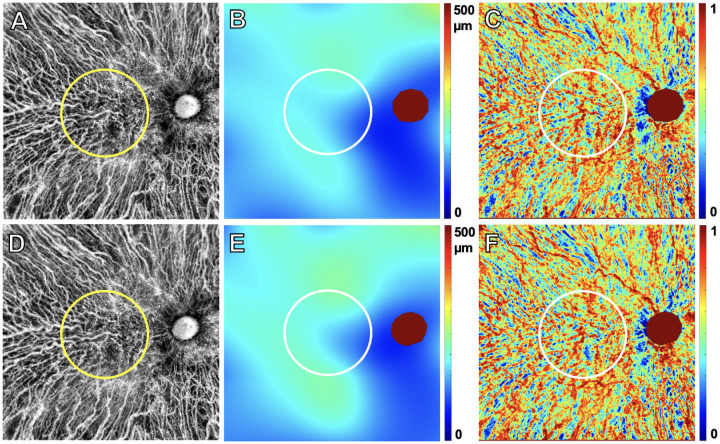
Figure 7.
Choroidal vasculature and CT results from SS-OCT 12 × 12-mm scans from the same nonexudative case that did not develop exudation during the follow-up period and the same visits shown in Figure 1. The top row images are from the penultimate visit prior to the last visit before the patient was followed for at least 6 consecutive months without exudation. The bottom row images are from the last visit prior to 6 consecutive months without exudation. The interval between these two visits was 84 days. Choroidal vasculature maps at visit 1 (A) and at visit 2 (D). The circle indicates the 5-mm circle centered on the fovea that was analyzed from these scans. CT maps at visit 1 (B) and at visit 2 (E); MCT in the 5-mm circle at visit 1 = 169.66 µm and at visit 2 = 182.18 µm. CVI maps at visit 1 (C) = 0.62 and at visit 2 (F) = 0.62.

