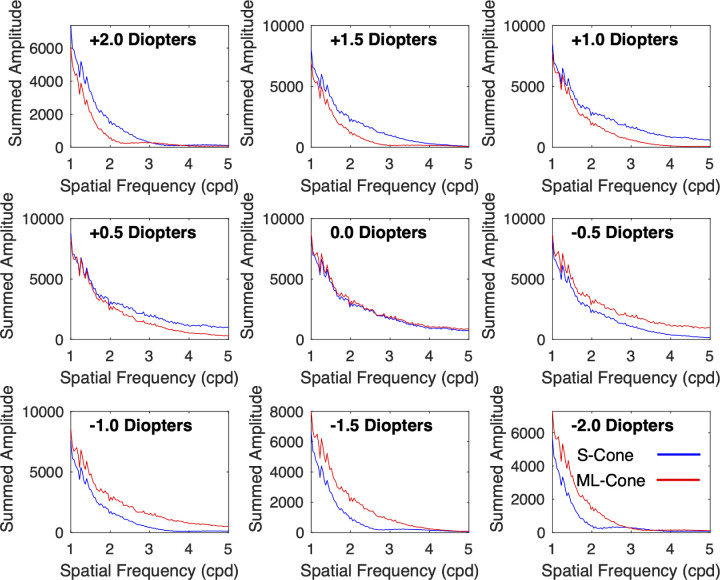
Figure 5.
Summed signal amplitude as a function of spatial frequency and defocus for a sample image. Data were taken from the sample hyperspectral image used in Figures 1 and 4. For this analysis, we assumed that the image spanned a horizontal range of 19.1 degrees of visual angle. Positive defocus indicates hyperopia (eye too short for its optics) and minus defocus indicates myopia (eye too long for its optics).

