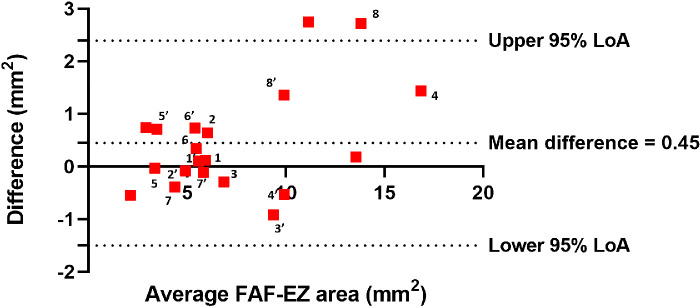
Figure 5.
A Bland-Altman plot of preserved FAF area and preserved EZ area (FAF-EZ). The mean difference was 0.45 (0.99) mm2. Top and bottom dashed lines: upper and lower 95% limit of agreement (−1.50, 2.39). The eight subjects (n = 1–8) with both eyes included in this study are labeled. The measurements from right eyes are labeled as n and the measurements from left eyes are labeled as n’.

