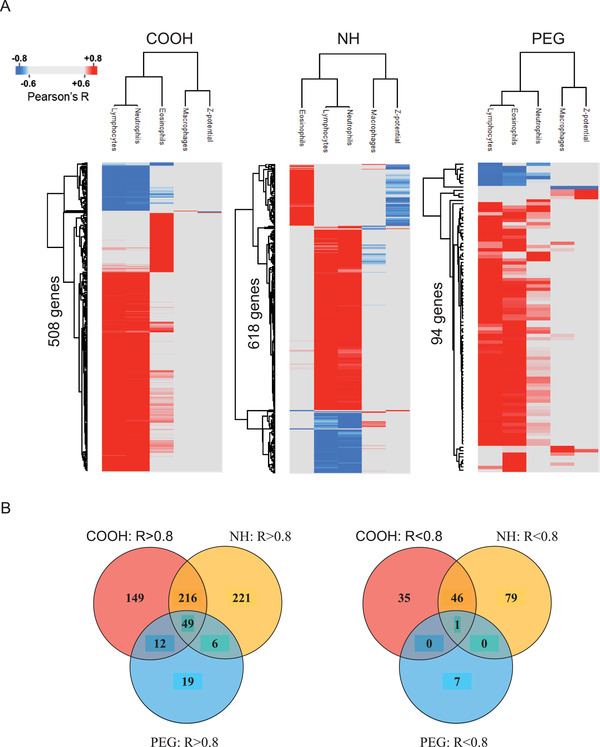
Figure 6.

DEG from functionalized ENM correlate with the BAL cell counts and corresponding zeta potential of particles. A) The strongest correlations (Pearson r ≥ |0.8|) are identified for lymphocytes and neutrophils, with both COOH (508 DEG) and NH (618 DEG) ENM, and in lesser amount with PEG (94 DEG), which also showed association to eosinophils. B) Most of these DEG were positively correlated (r ≥ 0.8) and 60% (510 genes) of all immune cell count‐associated genes (r ≥ |0.8|) are unique to a specific functionalization.
