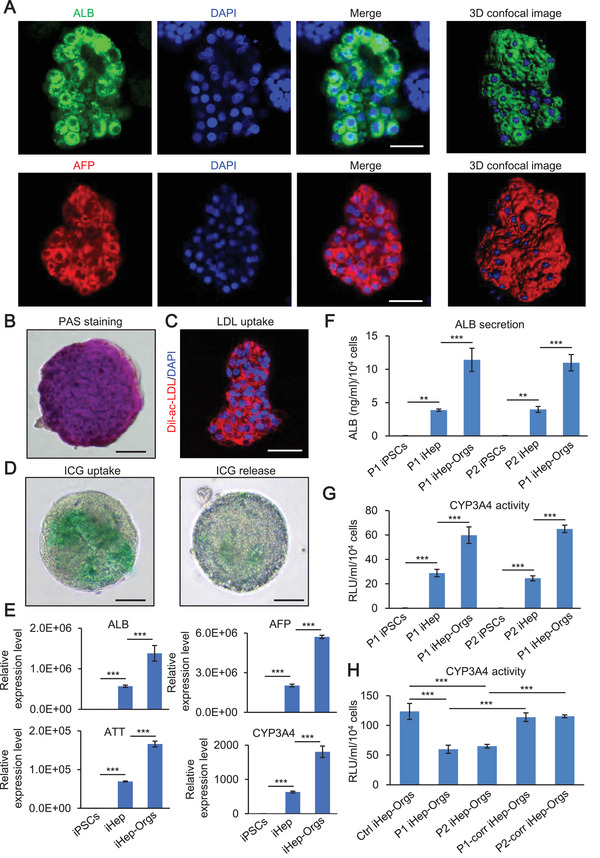
Figure 2.

Characterization of iHep‐Orgs. A) Confocal images of iHep‐Orgs. ALB (green), AFP (red), and DAPI (blue). Scale bar, 50 µm. B) Glycogen accumulation evaluated by PAS staining in iHep‐Orgs. Scale bar, 100 µm. C) LDL uptake evaluated by Dil‐ac‐LDL fluorescent staining in iHep‐Orgs. Dil‐ac‐LDL (red) and DAPI (blue). Scale bar, 50 µm. D) ICG uptake and release in iHep‐Orgs. Scale bar, 100 µm. E) Relative expression level of liver specific marker in iPSCs, iHep, and iHep‐Orgs. F) Quantitation of ALB secretion in iPSCs, iHep, and iHep‐Orgs. G) Quantitation of CYP3A4 activity in iPSCs, iHep, and iHep‐Orgs. H) Quantitation of CYP3A4 activity in control, patient, and corrected iHep‐Orgs. These data are represented as mean ± SD (n = 3) and statistics were assessed using one‐way ANOVA followed by post‐hoc Holm–Sidak test, **p <0.01; ***p < 0.001.
