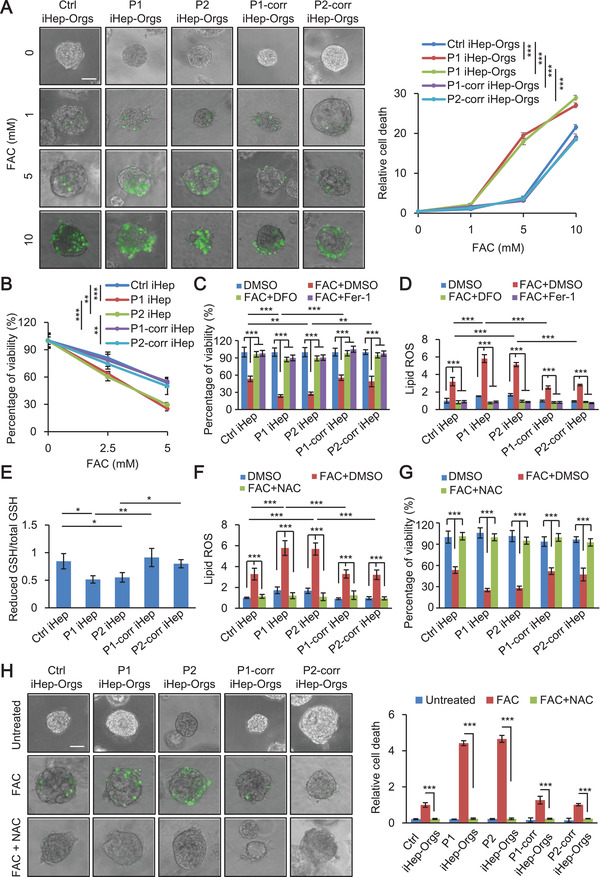
Figure 4.

Patient iHep‐Orgs and iHep sensitivity to iron overload‐induced ferroptosis is rescued by the GSH precursor, NAC. A) Live‐cell imaging of control, patient and corrected iHep‐Orgs incubated with SYTOX Green with indicated concentration of FAC for 72 h. Scale bar, 50 µm (left). Quantification of relative cell death of control, patient, and corrected iHep‐Orgs (right) (n = 3, 50 organoids per group with three biological replicates). B) Cell viability of control, patient, and corrected iHep after treatment with FAC for 48 h. C) Measurement of cell viability of control, patient and corrected iHep with or without FAC and two ferroptosis specific inhibitors, DFO and Fer‐1 for 48 h (FAC, 5 × 10⁻³ m; DFO, 0.5 mµ; Fer‐1, 10 × 10−6 m). D) Measurement of lipid peroxidation in control, patient and corrected iHep with or without FAC and DFO, Fer‐1 for 24 h (FAC, 5 × 10⁻³ m; DFO, 0.5 mµ; Fer‐1, 10 × 10−6 m). E) Measurement of reduced GSH/total GSH in control, patient and corrected iHep. F) Measurement of lipid peroxidation in control, patient, and corrected iHep, after treatment with or without FAC and NAC for 24 h (FAC, 5 × 10⁻³ m; NAC, 5 × 10⁻³ m). G) Measurement of cell viability in control, patient and corrected iHep, after treatment with or without FAC and NAC for 48 h (FAC, 5 × 10⁻³ m; NAC, 5 × 10⁻³ m). H) Live‐cell imaging of control, patient, and corrected iHep‐Orgs incubated with SYTOX Green with FAC and NAC for 72 h (FAC, 5 × 10⁻³ m; NAC, 5 × 10⁻³ m). Scale bar, 50 µm (left). Quantification of relative cell death of control, patient and corrected iHep‐Orgs (right) (n = 3, 50 organoids per group with three biological replicates). These data are represented as mean ± SD (n = 3) and statistics was assessed using one‐way ANOVA A,B,E) and two‐way ANOVA C,D,F,G,H) followed by post‐hoc Holm–Sidak test, *p < 0.05;**p <0.01; ***p < 0.001.
