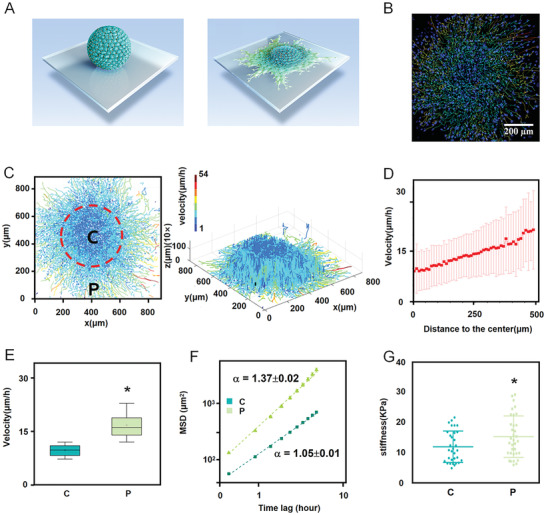
Figure 1.

Central and peripheral subpopulations in stem cell spheroid show distinct collective spreading dynamics and cellular biomechanical properties. A) Scheme of MSC spheroid spreading. B) Representative immunofluorescent images for MSC spheroid spreading. C) A heatmap of each single cell's movement trail and speed. D) Quantification of cell spreading velocities showing that cellular velocity increased along with the distance to the spheroid center. The error bar represents the standard deviation. E,F Velocities and MSD curves of cell movements indicating that peripheral cells were faster and in directional motion (α = 1.37), whereas central cells were in randomly diffusive motion (α = 1.05). The time lag is from 0.5 to 5 h. G) Quantification of MSC stiffness showing that the peripheral cells were stiffer than the central cells, as measured by AFM. Data are the means ± SEM (E, F, G). *P < 0.05; two‐tailed unpaired Student's t‐test (E,G).
