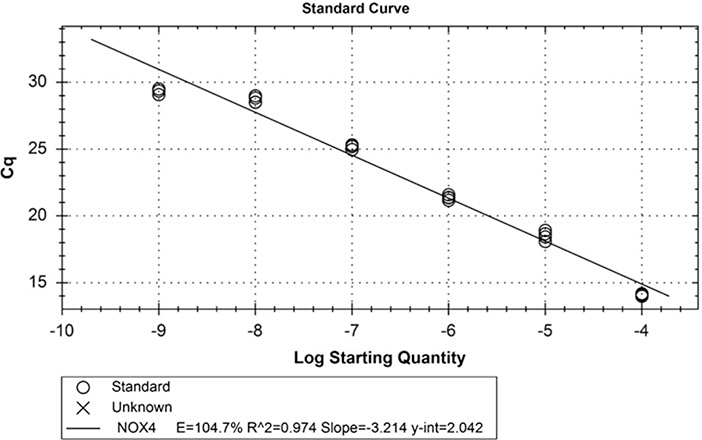
Fig. 4.
Example of a RT-qPCR standard curve used for the determination of primer set efficiency. Ten tenfold serial dilutions were made from pcDNA3.1-NOX4 variant 1 at a starting concentration of 1 μg/μL. Primers (200 nM) for NOX4 (E4F and E5R) from Table 2 were used. The Cq values were plotted vs. log (dilution-fold), and the efficiency of the primer set was determined from the slope

