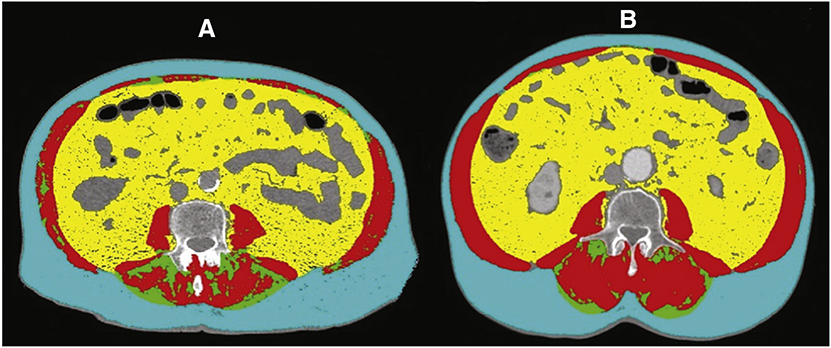
Figure 1.
Computed tomographic analysis of body composition. CT images (A and B) using Slice-O-Matic software, version 5.0 (Tomovision). A brief overview of this analysis can be found here: https://www.youtube.com/watch?v=KJrsQ_dg5mM. Skeletal muscle (red), visceral adipose tissue (yellow), subcutaneous adipose tissue (blue), and intramuscular adipose tissue (green). A, An 83-year-old male sarcopenic patient with a BMI of 30 kg/m2 and an SMI of 33 cm2/m2. B, A 77-year-old male nonsarcopenic patient with a BMI of 31 kg/m2 and an SMI of 65 cm2/m2.

