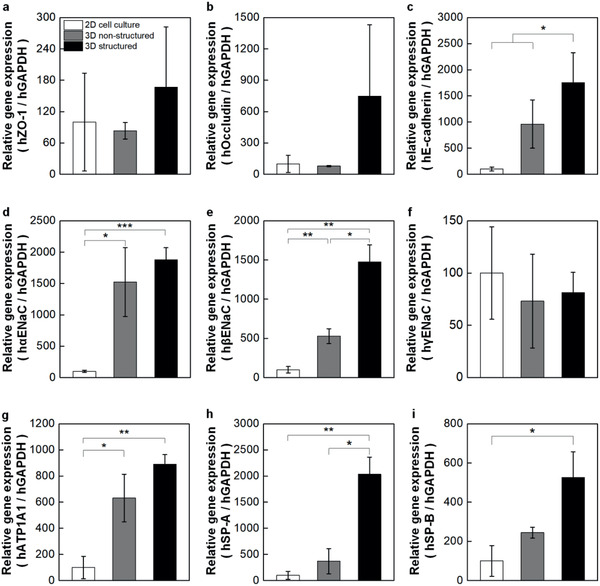
Figure 6.

Comparison of representative alveolar gene expression profiles between conventional and 3D inkjet‐printed structured models. Relative mRNA expression was measured via qPCR for 2D cell culture, 3D non‐structured, and 3D structured models using specific markers involved in a–c) intercelluar junction formation, d–g) epithelial ion channels and ion transport, and h,i) pulmonary surfactant secretion. Each expression levels were normalized by the level of 2D cell culture models. (n = 12, 9, and 13 for 2D cell culture, 3D non‐structured, and 3D structured models, respectively. The expression level of each gene was normalized by the value at expression level of 2D cell culture group.)
