Figure 5.

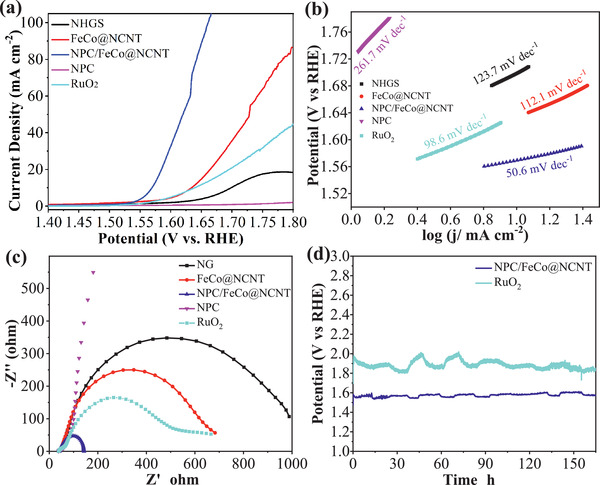
OER performance of NHGS, FeCo@NCNT, NPC/FeCo@NCNT, NPC, and RuO2 in 0.1 m KOH. a) OER polarization curves, b) Tafel plots, c) EIS Nyquist plots. d) Stability evaluation of NPC/FeCo@NCNT and RuO2 at 10 mA cm−2.

OER performance of NHGS, FeCo@NCNT, NPC/FeCo@NCNT, NPC, and RuO2 in 0.1 m KOH. a) OER polarization curves, b) Tafel plots, c) EIS Nyquist plots. d) Stability evaluation of NPC/FeCo@NCNT and RuO2 at 10 mA cm−2.