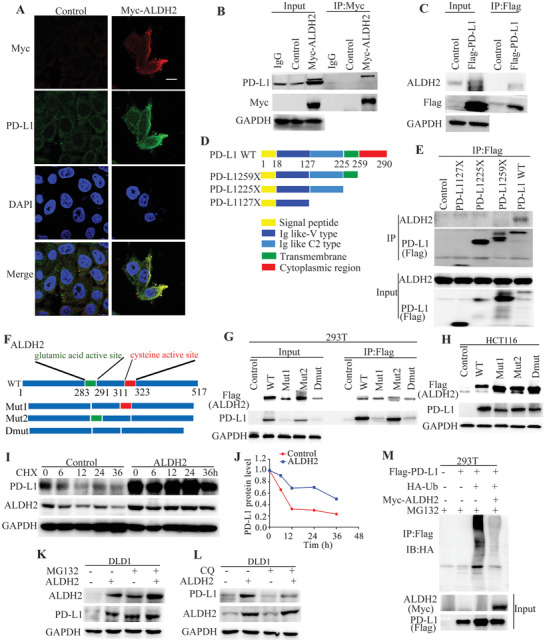
Figure 3.

ALDH2 physically interacted with PD‐L1 through binding to its cytoplasmic domain. A) Immunofluorescence imaging of endogenous PD‐L1 and exogenous Myc‐ALDH2 proteins in THC8307 cells. Scale bars indicate 20 µm. B,C) The interaction between ALDH2 and PD‐L1 was confirmed by co‐IP assay. D) A map showing the three constructs of mutant PD‐L1 with different truncated domains. E) Data from Co‐IP assay revealed that ALDH2 interacts with the cytoplasmic region (amino acid residues 260–290) of PD‐L1. F) A schematic diagram showing the glutamic acid (283–291) and cysteine active site (311–323) of ALDH2. G) Co‐IP assay showing that the interaction between PD‐L1 and different ALDH2 mutants in 293T cells. H) Western blot detecting the effects of different ALDH2 mutants on PD‐L1 expression in HCT116 cells. I) Increased PD‐L1 protein stability was observed by CHX assay after ectopic overexpression of ALDH2 in DLD1 cells. J) X–Y graph comparing the rate of PD‐L1 protein degradation with or without ALDH2 overexpression. K,L) Western blot analysis investigating the effect of proteasome inhibitor (MG132, 30 × 10−6 m) or lysosomal inhibitor (chloroquine, 50 × 10−6 m) on ALDH2 and PD‐L1 protein expression in DLD1 cells with or without ALDH2 overexpression cells were harvested at 12 h after MG132 or chloroquine incubation. M) In vitro ubiquitin conjugation assay showing the increased ubquitination of PD‐L1 in the presence of ALDH2 ectopic overexpression. Whole cell lysates of 293T cells transfected with the indicated constructs were harvested at 12 h after incubation with MG132 (30 × 10−6 m). All western blot analyses were repeated for three times independently with similar results.
