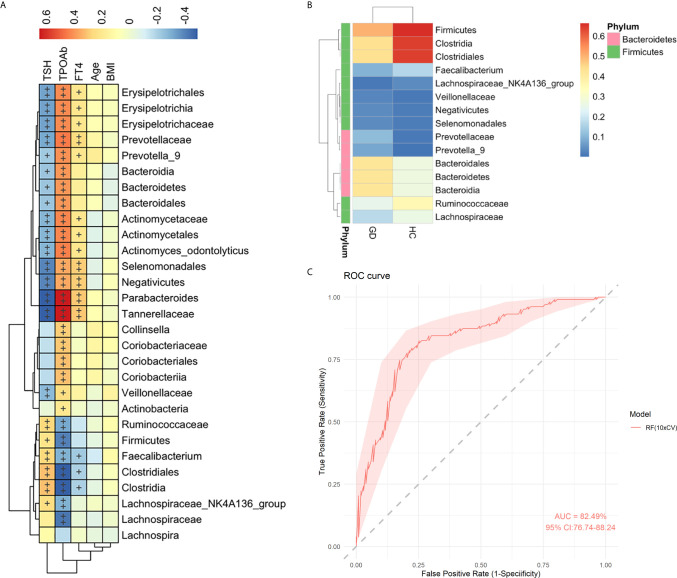
Figure 3.
Spearman correlation analysis of the gut microbiota with clinical parameters. Heatmap showing the relationships of altered 29 gut microbiota and 5 clinical parameters in healthy controls and GD patients. Color intensity indicates the magnitude of correlation. Red = positive correlation; blue = negative correlation. +p < 0.05, ++p < 0.01. BMI, body mass index; FT4, free thyroxine; TSH, thyrotropin; TPOAb, thyroperoxidase antibody (A). Heatmap analyses of the relative abundant of top 15 taxa from 29 gut microbiota. The heatmap plot depicts the relative abundance of each bacterial taxa (vertical axis) within each group (horizontal axis). The color of the spot in the right panel corresponds to the relative values of the taxa in each group (B). Random forest analysis was used to classify GD patients and healthy controls based on the top 15 most abundant taxa. The performance of the random forest analysis was assessed with the AUC of the ROC curve. The light pink area indicates the 95% confidence interval (C).

