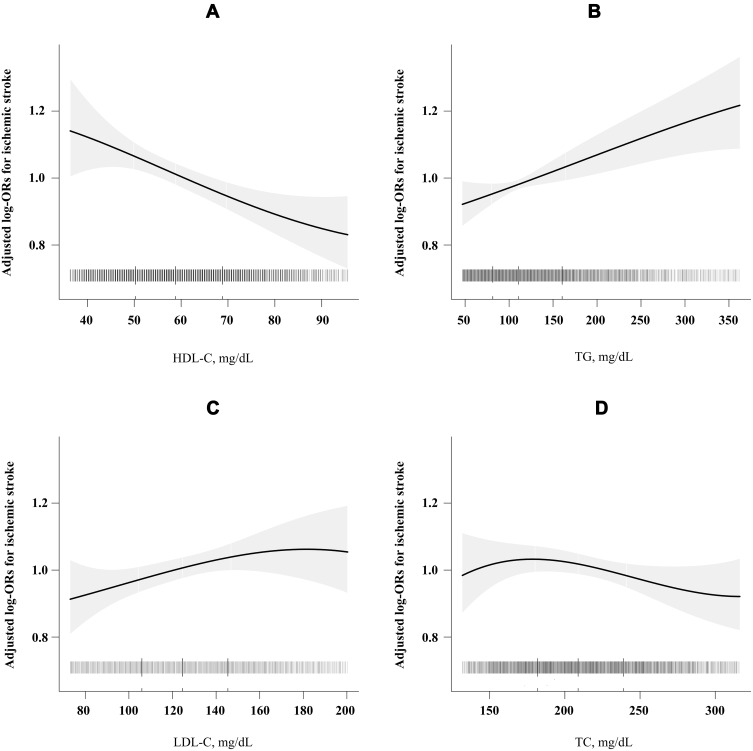
Figure 1.
Smoothing curves for the association of first IS with HDL-C, TG, LDL-C and TC. All the panels adjusted for body mass index (BMI), systolic blood pressure (SBP), diastolic blood pressure (DBP), fasting glucose, smoking status, alcohol consumption, use of antihypertensive drugs, and glucose-lowering drugs, total homocysteine (tHcy), and estimated glomerular filtration rate (eGFR). HDL-C (A): adjusted for all the above variables plus TG and LDL-C.TG (B): adjusted for all the above variables plus TC.LDL-C (C): adjusted for all the above variables plus HDL-C and TG.TC (D): adjusted for all the above variables plus TG.

