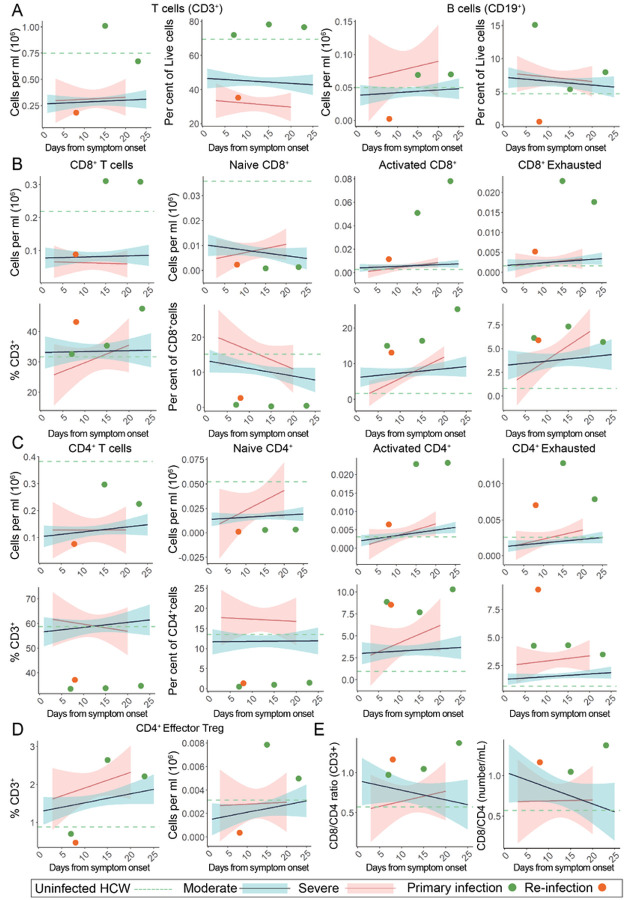
Figure 3.
Peripheral lymphocyte profiling of SARS-CoV-2 primary and reinfection demonstrates persistent T cell exhaustion and loss of B cells. For all graphs, blue linear least squares regression lines and corresponding shading represent the average trend and error bars, respectively, for patients with moderate COVID-19. Red linear least squares regression lines and corresponding shading represent the average trend and error bars, respectively, for patients with severe COVID-19. The dashed green line represents the average value of healthy, uninfected healthcare workers (HCW) plotted as a constant value across all days for reference. Individual scatter points represent the values for the patient during the primary SARS-CoV-2 infection (green) at 7, 15, and 23 DFSO and the reinfection (orange) at 8 DFSO*. (A) Total T cells and B cells isolated from patient whole blood. (B) CD8+ T cell subsets plotted as number (top) and relative percentage of parent (bottom). (C) CD4+ T cell subsets plotted as number (top) and relative percentage of parent (bottom). (D) CD4+ TFH cell subsets plotted as number and percentage of parent CD3+. (E) CD8+ / CD4+ ratios calculated relative to days from symptom onset.

