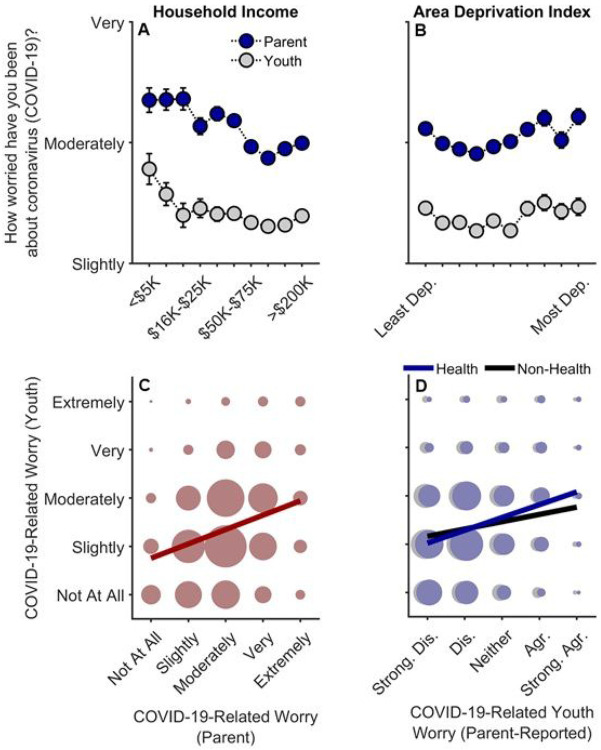
Figure 3.
Parental and youth worry levels about COVID-19. (A, B) Worry levels as functions of annual household income and area deprivation index. Error bars represent ±1 between-subjects standard error of the means. Analyses of parental worry controlled for caregiver/parental education, caregiver/parent race, caregiver/parent ethnicity, questionnaire number, participants’ baseline study site, and participant ID. Analyses of youth worry controlled for caregiver/parental education, child race, child ethnicity, child sex, child age, questionnaire number, participants’ baseline study site, and participant. Area deprivation index was collapsed across continuous deciles for graphing. (C) Youths’ worry levels by parents’ worry levels. (D) Youths’ worry levels by parent-reported youth worry levels about the health- and non-health-related consequences of the COVID-19 pandemic. (C, D) The size of the circles reflects the number of datapoints at each x-y coordinate. The solid lines are best fitting simple regression lines. Dep. = Deprived. Strong. Dis. = Strongly Disagree. Dis. = Disagree. Agr. = Agree. Strong. Agr. = Strongly Agree.

