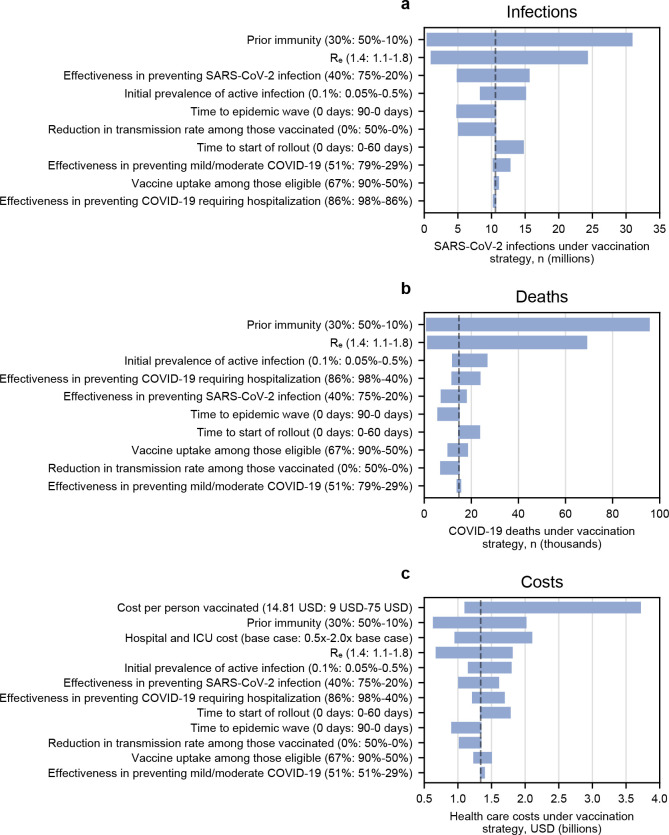
Figure 1. One-way sensitivity analysis, influence of each parameter on cumulative SARS-CoV-2 infections, COVID-19 deaths, and health care costs.
This tornado diagram demonstrates the relative influence of varying each key model parameter on clinical and economic outcomes over 360 days. This is intended to reflect the different scenarios in which a reference vaccination program (vaccine supply sufficient for 67% of South Africa’s population, pace 150,000 vaccinations per day) might be implemented. The dashed line represents the base case scenario for each parameter. Each parameter is listed on the vertical axis, and in parentheses are the base case value and, after a colon, the range examined. The number on the left of the range represents the left-most part of the corresponding bar, and the number on the right of the range represents the right-most part of the corresponding bar. The horizontal axis shows the following outcomes of a reference vaccination program: (a) cumulative SARS-CoV-2 infections; (b) cumulative COVID-19 deaths; (c) cumulative health care costs. In some analyses, the lowest or highest value of an examined parameter produced a result that fell in the middle of the displayed range of results, due to stochastic variability when the range of results was narrow.

