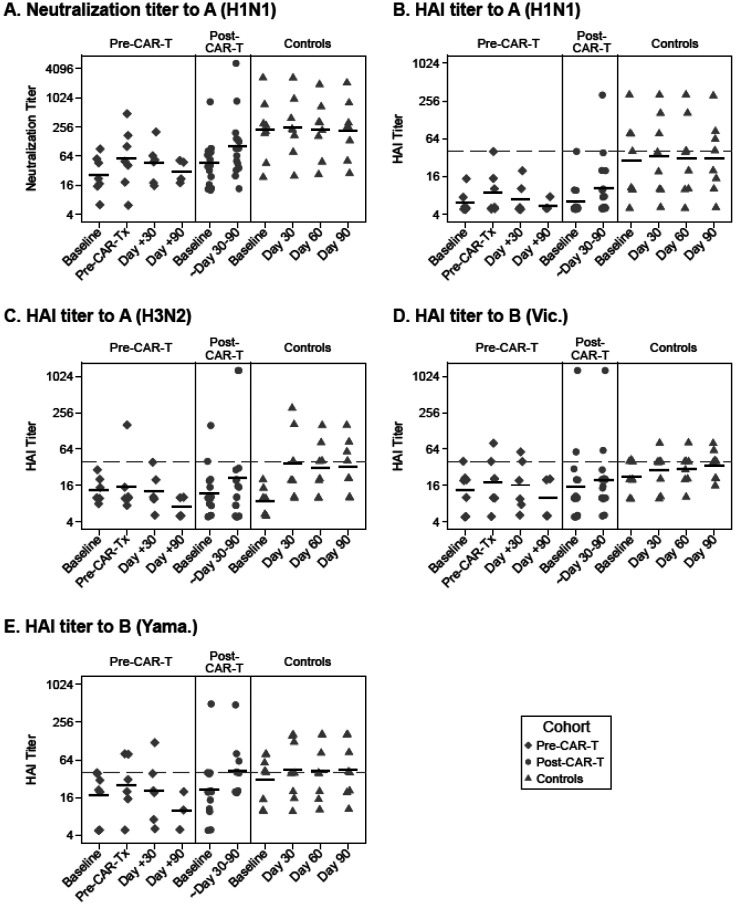
Figure 4. Summary of longitudinal influenza antibody kinetics and geometric mean titers for each cohort.
Individual titer results are plotted per sample collection time points for the pre-CAR-T, post-CAR-T, and control cohorts (from left to right in each panel). (A) Neutralization titers to A(H1N1) and (B) hemagglutination inhibition (HAI) titers to A(H1N1), (C) A(H3N2), (D) B(Victoria), and (E) B(Yamagata) are shown. Data have been jittered to allow viewing of overlapping values. Horizontal bars represent geometric mean titers (GMT). Symbols on or above the dashed horizontal line represent HAI titers ≥40.

