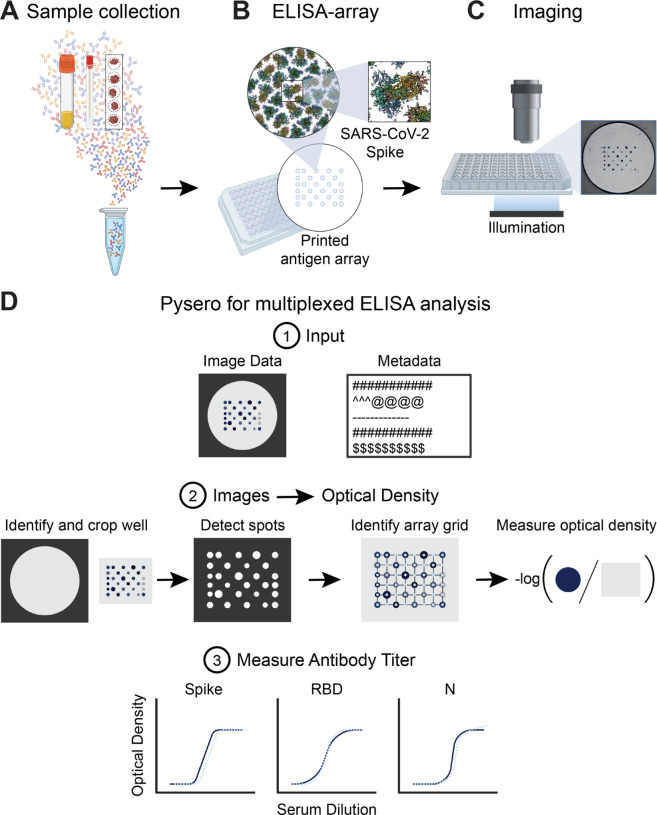
Fig. 1. Overview of multiSero pipeline:
(A) Sample containing antibodies derived from serum, saliva swabs, dried blood spots, or other source are overlaid onto antigen array (B) printed by a protein arrayer such as Scienion sciFLEXARRAYER S12. Each spot in the array contains a concentration of a single protein or protein domain. (C) The ELISA is performed and then the array is imaged using Nautilus plate reader or alternative reader. (D) Pysero is used to analyze printed substrate multi-antigen ELISA-arrays. The software takes well images and a metadata file describing experimental conditions and imaging parameters as input (D1). The images are auto-cropped around the antigen array. Antigen spots are detected and a grid is registered to the spots. Optical densities are computed from the spots that align with the registered grid. Optical density is computed as the −log of the ratio of spot intensity to the background intensity (D2). Sample antibody titer against each antigen in the array can then be measured based on the ODs of the controls in the assay (D3).

