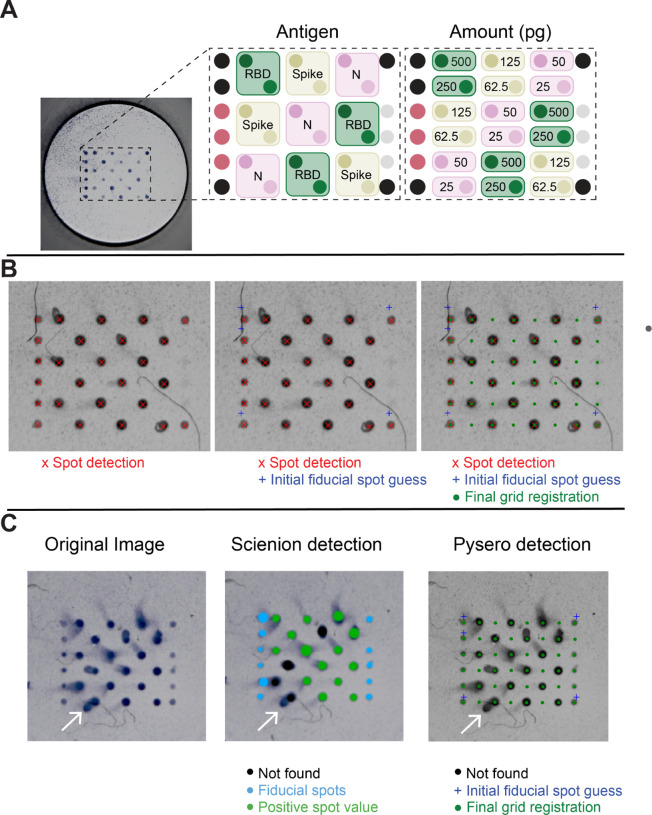
Fig. 2. ELISA-array for SARS-CoV-2 and its analysis with pysero.
(A) Image of well containing Scienion-printed antigen array. Array layout shows the relative locations of SARS-CoV-2 antigens included in the array: receptor binding domain of spike-RBD (RBD; green), spike (ochre), and nucleoprotein (N; pink). Each antigen was spotted at two concentrations which are indicated in the right panel of the layout. Black spots represent anti-kappa-biotin fiducials, mauve spots represent anti-IgG Fc, and grey spots represent GFP foldon. (B) Pysero first detects center points of all spots in the cropped image (red x). Fiducial positions (blue +) are initialized based on detected spot coordinates. Coordinate transformation that registers the initial fiducials with detected fiducials is estimated using particle filtering. A grid containing all spot locations (green·) in the antigen layout is then transformed onto the image using the estimated coordinate transformation. The coordinates of each spot are then used to crop individual spots and extract their OD. (C) Comparison of Scienion analysis and pysero spot detection. Original image of a well imaged by SciREADER CL2 includes comets (white arrow) and fiber-like debris. Center image is the output of Scienion spot detection and analysis. A black spot indicates an analyte-containing spot was not found at the location, green spots indicate positive spot value, and blue spots indicate the location of fiducial spots. The size of the spot indicates the area analyzed by Scienion. Right image is the output of pysero. Green dots indicate registered grid positions (size of marker unrelated to area analyzed), blue crosses indicate initialized fiducial spots.

