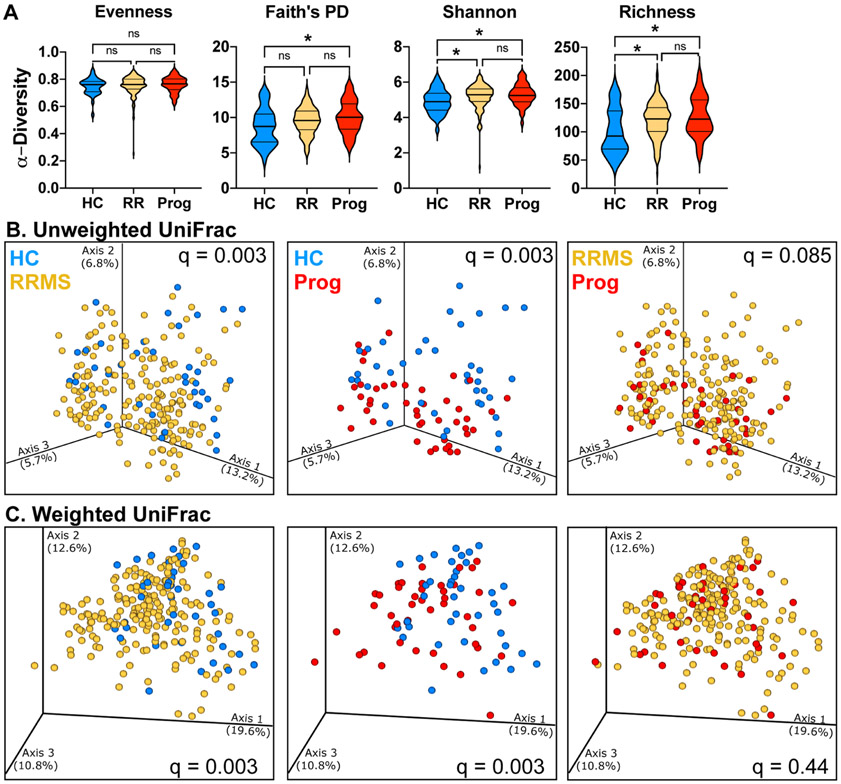
Figure 1. Microbiota α- and β-diversity in relapsing and progressive MS.
A) Alpha diversity metrics for Evenness, Faith’s phylogenetic diversity, Shannon diversity, and richness (number of features) were calculated at an average sampling depth of 5,000 reads per sample in healthy controls (n = 40), RRMS (n = 199), and progressive MS (n = 44). * p < 0.05 Kruskal-Wallis. B-C) Principal coordinate analysis of intestinal microbiota samples based on unweighted (B) and weighted (C) UniFrac distances show significantly different clustering between HC and RRMS, between HC and progressive MS, but not between RRMS and progressive MS, q = PERMANOVA p-values adjusted for false discovery rate. Each dot represents the microbiota from one individual. HC, healthy control (blue), RRMS (yellow), or progressive MS (red).

