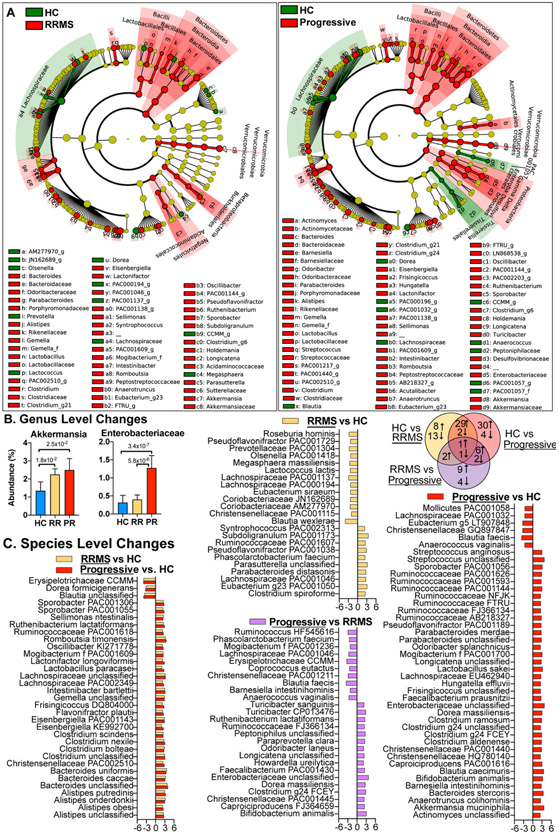
Figure 2. Compositional differences in the microbiota of progressive and relapsing MS.
Microbiota was sequenced in healthy controls (HC, n=40), RRMS (n = 199), and Progressive MS (n = 44) subjects. A) Differences are visualized on a cladogram, which shows all changes at the phylum level (inner dots, outer wedge label) through genus level (outer dots, labeled with small letters for abbreviation). Red (MS) or green (HC) circles indicate increased levels in corresponding groups, yellow circles indicates a taxon present but not differentially abundant. Size of the dot corresponds to the overall abundance of that taxon in the microbiome. B) The relative abundance of selected microbiota altered in progressive MS. C) LDA effect size of significantly altered bacteria at the lowest classifiable levels and Venn diagram showing the number of bacteria increased or decreased in each comparison. Positive LDA effect size = up in the underlined group.

