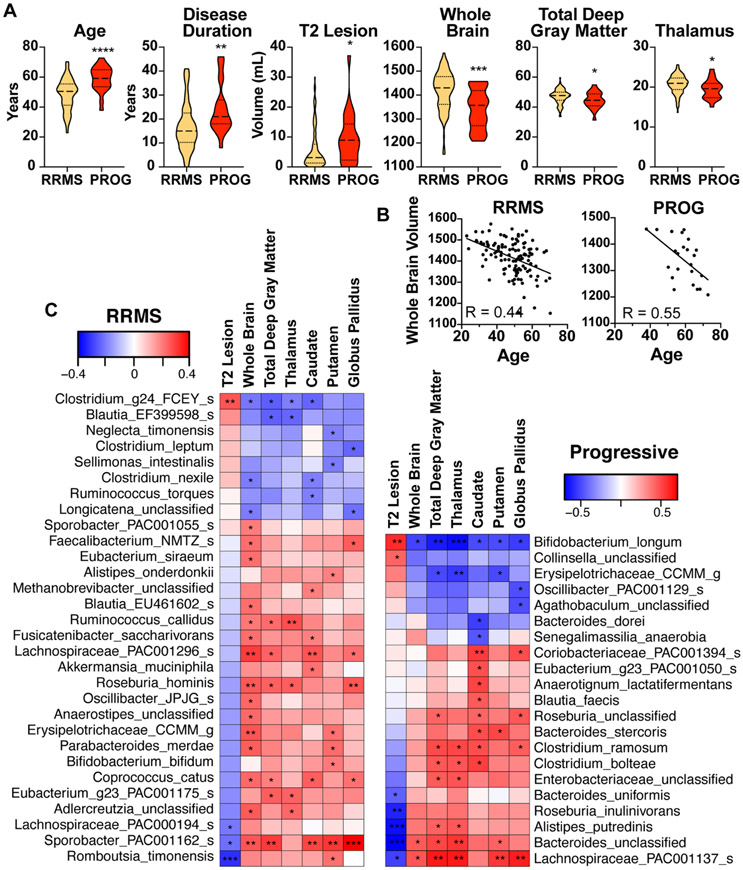
Figure 6. Associations between the microbiota and MRI brain measurements in progressive MS.
A) Age, disease duration, and brain 3T MRI measurements in progressive MS (n = 23) and RRMS (n = 116) patients, t-test. B) Brain volume negatively correlated with age, linear regression, p <0.001, R = 0.44 and 0.55 for RRMS and progressive MS, respectively. C) Bacteria that correlate with lesion volume (upper section) and brain volume (lower section) in RRMS and progressive MS. Spearman correlation adjusted for age. * p < 0.05, ** p < 0.01, *** p < 0.001.

