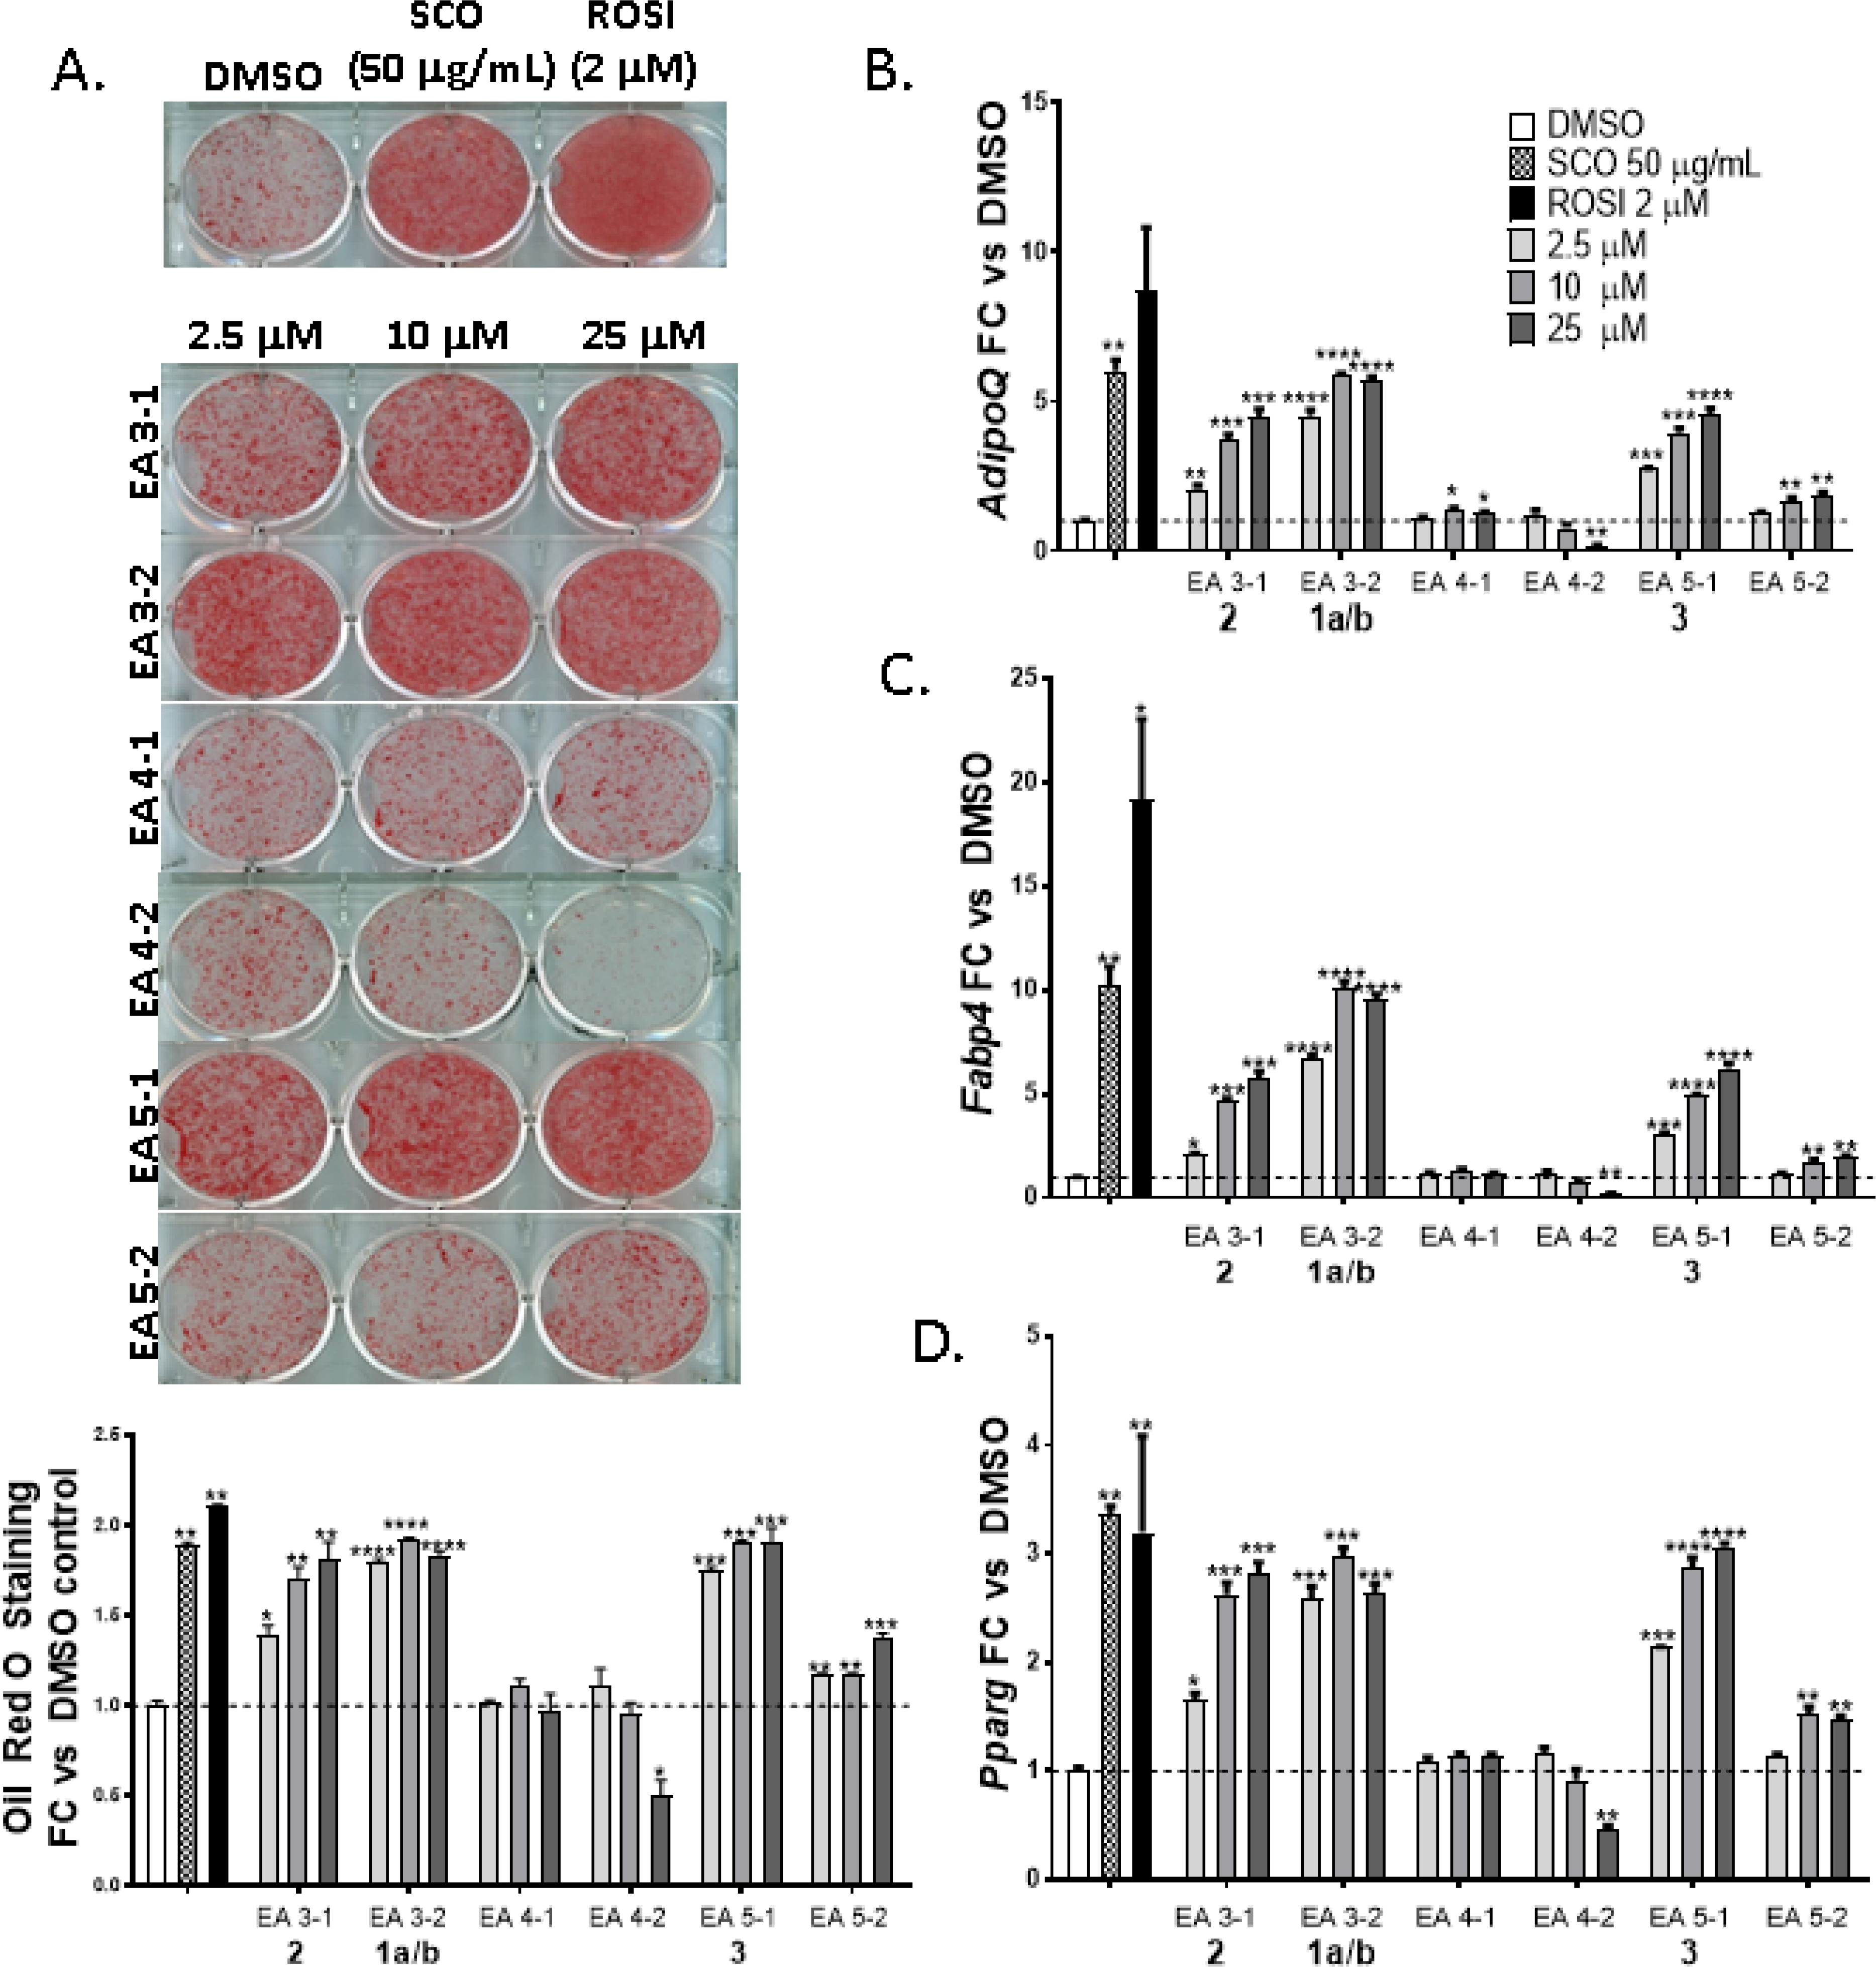
Figure 4.

Compounds 1a/b, 2 and 3 from A. scoparia promote adipogenesis: 3T3-L1 cells were induced to differentiate using half-strength MDI cocktail containing DMSO vehicle, 50 μg/mL SCO, 2 μM ROSI, or one of three doses of test compounds (2.5, 10, or 25 μM). Cells were then either fixed and stained with Oil Red O (4 days post-differentiation) (panel A), or harvested (3 days post differentiation) for RNA isolation and gene expression analysis of adiponectin (AdipoQ), fatty acid binding protein 4 (Fabp4), or Pparγ (panels B-D). All treatments were compared to their respective DMSO controls. The effects of SCO and ROSI were analyzed by t-tests, while the effects of individual test compounds were analyzed by one-way ANOVA. *p >0.05, ** p <0.01, *** p <0.001, **** p < 0.0001 vs. DMSO controls.
