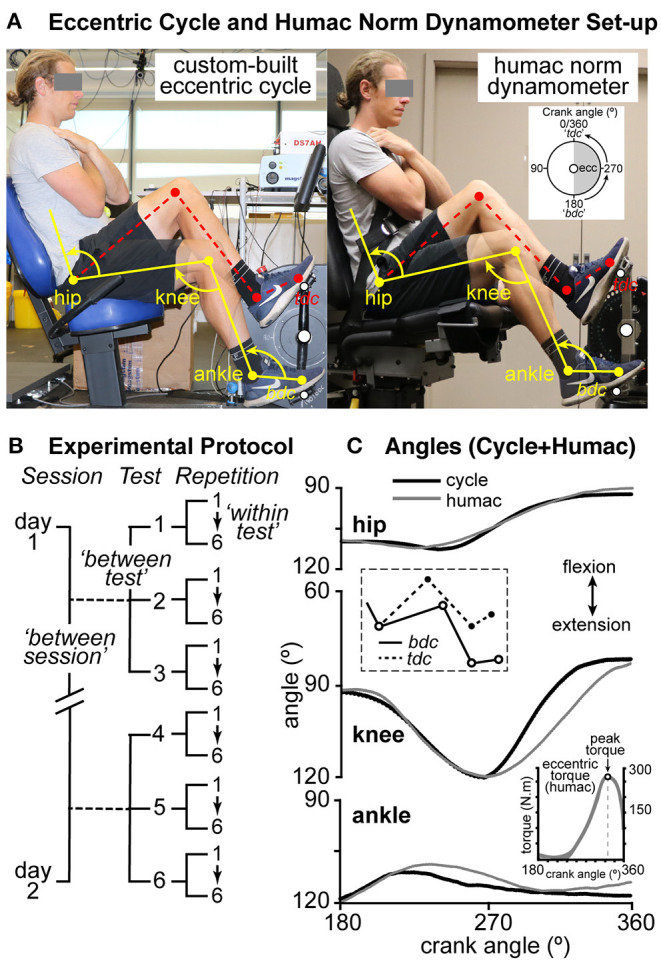
Figure 1.

(A) A subject seated on the custom-built eccentric (ECC) cycle (left) and isokinetic dynamometer (right). Hip, knee, and ankle angles are illustrated at bottom dead center (“bdc,” yellow) and top dead center (“tdc,” red dashed lines). Inset (right side) illustrates the approximate area in which ECC torque was exerted on the dynamometer (shaded area). (B) Outline of the experimental protocol (see Materials and Methods). (C) Mean hip, knee, and ankle angles for one subject between 180° (bdc) and 0/360° (tdc) for both the semi-recumbent cycle (black lines) and Humac dynamometer (gray lines). Inset (bottom right) represents the mean torque recorded by the isokinetic dynamometer for one peak ECC torque protocol (PETP) (six repetitions).
