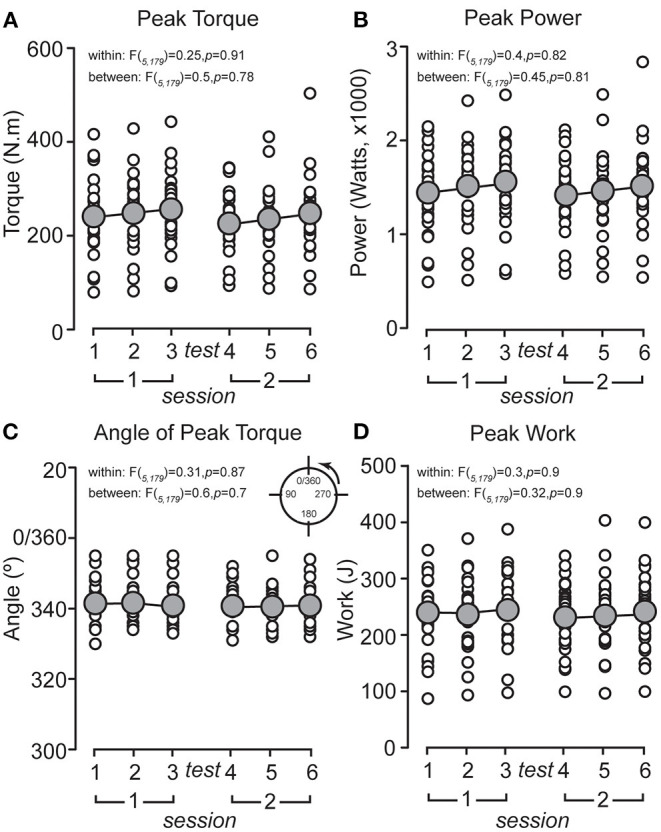
Figure 2.

Mean peak (of six repetitions) data for all participants (n = 30) plotted for each peak eccentric torque protocol (PETP) for (A) peak torque, (B) peak power, (C) angle of peak torque, and (D) peak work. The population mean for each test is represented by the gray circle.
