Figure 5:
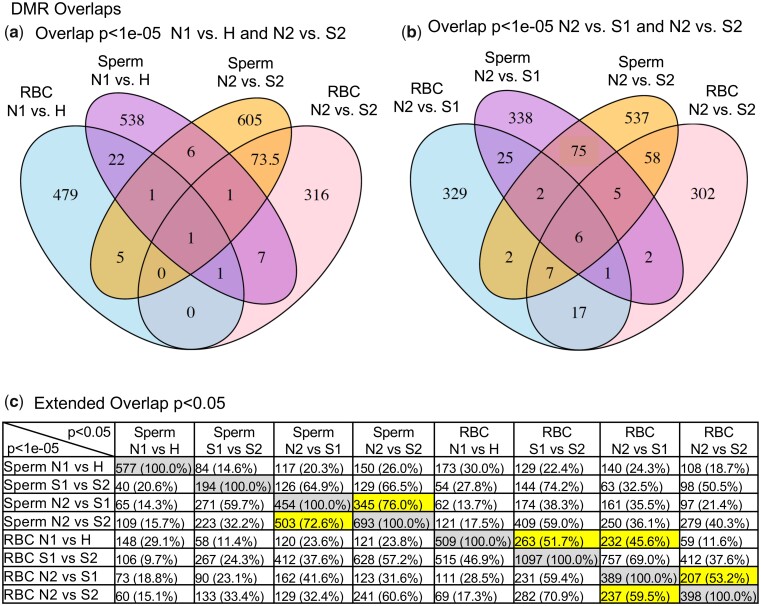
DMR overlaps (a) DMR overlap between sperm and RBC DMR (N1 vs H and N2 vs S2). (b) Sperm and RBC overlap P < 1e−05 N2 vs S1 and N2 vs S2. (c) Extended DMR overlap P < 1e−05 vs P < 0.05. The horizontal line indicating the number of DMR overlap and percentage at P < 0.05. Gray highlight is anticipated 100% overlap and yellow highlight overlaps mentioned in the text

