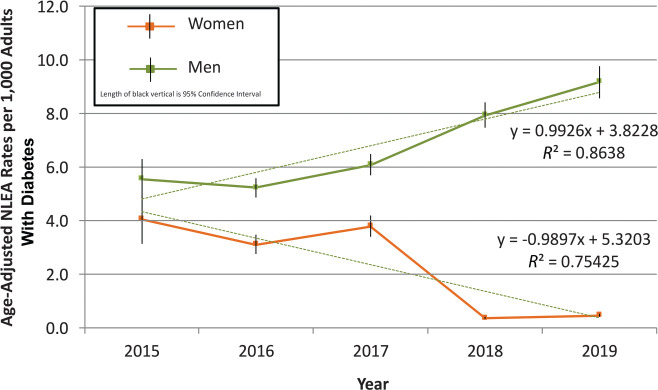
Figure 1.
All age-adjusted NLEA rates, males and females, with 95% CIs and trend line. The change in the number of NLEA cases per year between men and women is depicted by the trend lines showing a steady increase in men between 2015 and 2019, while the rates for women decreased from 2017 to 2018, similar to findings by Geiss et al. (3) at the national level.

