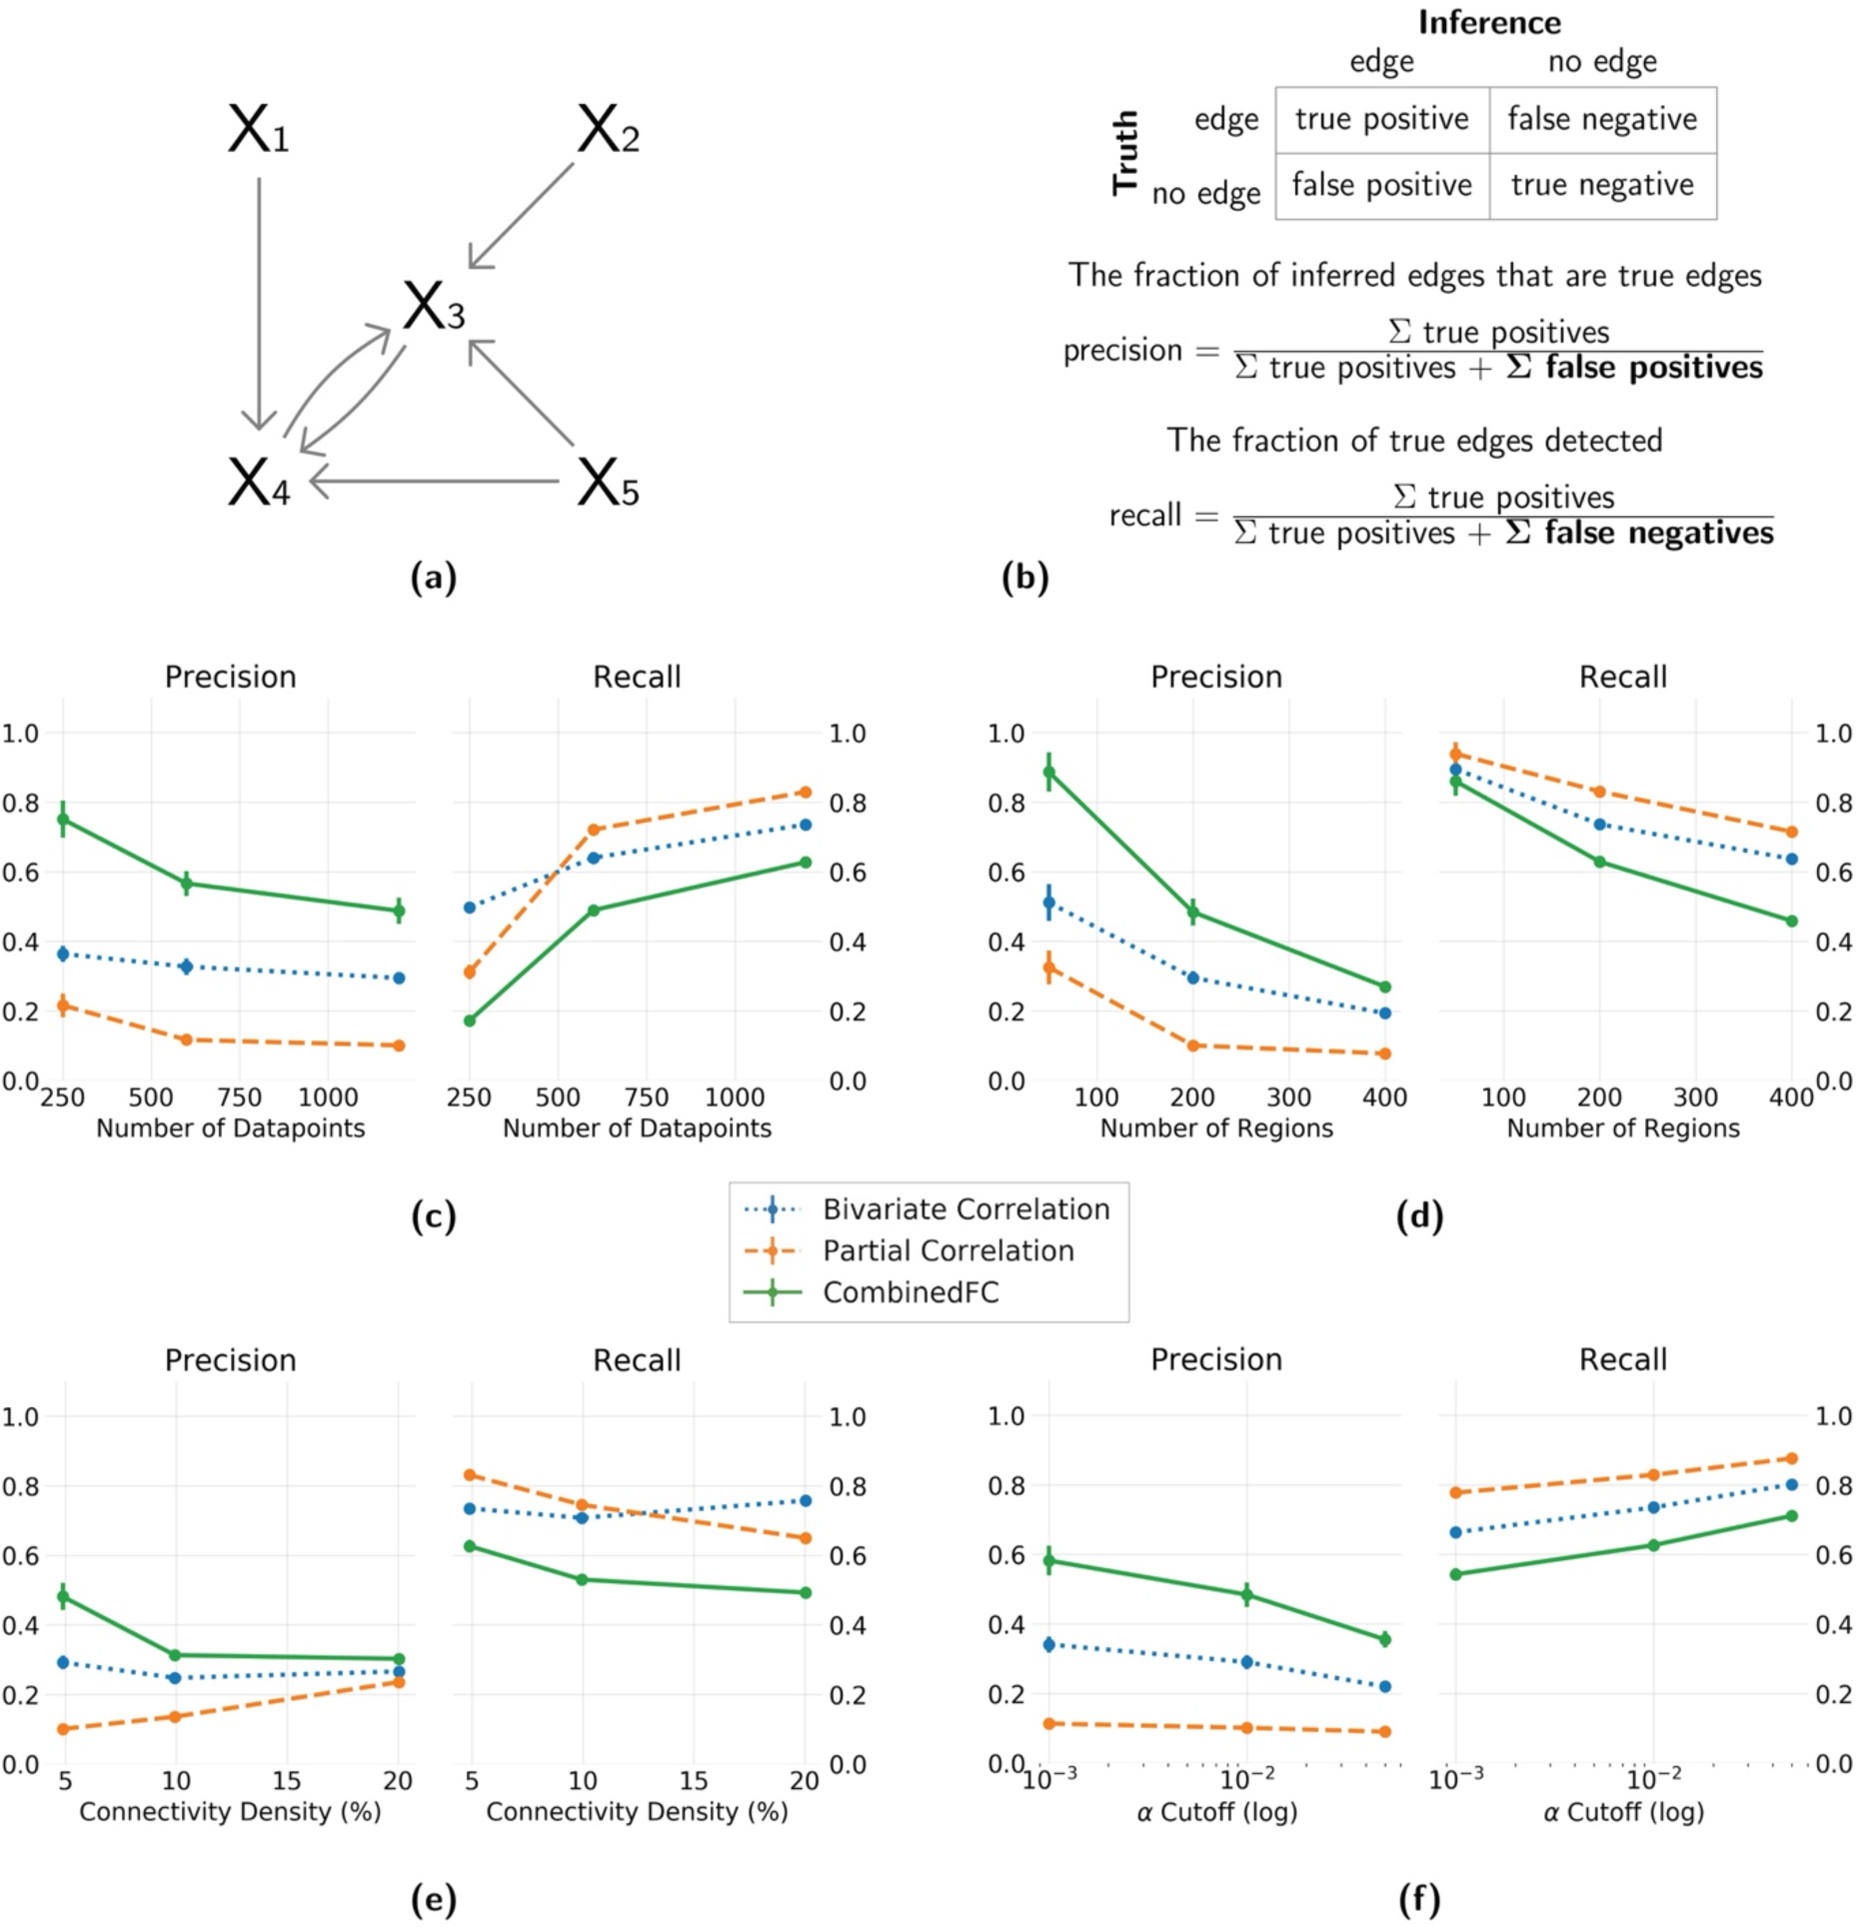
Figure 3. Precision and recall for simulated networks with a larger number of colliders than confounders and chains.

(a) An example of a 5 node network generated with a power law process, with more colliders than confounders and chains. (b) Formulas for precision and recall based on the sum of true positive, false positive and false negative inferred edges, relative to a true network. Results show average and standard deviation across 100 instantiations. Four different parameters are varied independently: (c) number of datapoints = {250, 600, 1200}, (d) number of regions = {50, 200, 400}, (e) connectivity density = {5%, 10%, 20%} and (f) α cutoff for the significance test = {0.001, 0.01, 0.05}. In panel f the values are plotted in logarithmic scale for better visualization. When one parameter was varied the other three were fixed at the value in bold.
