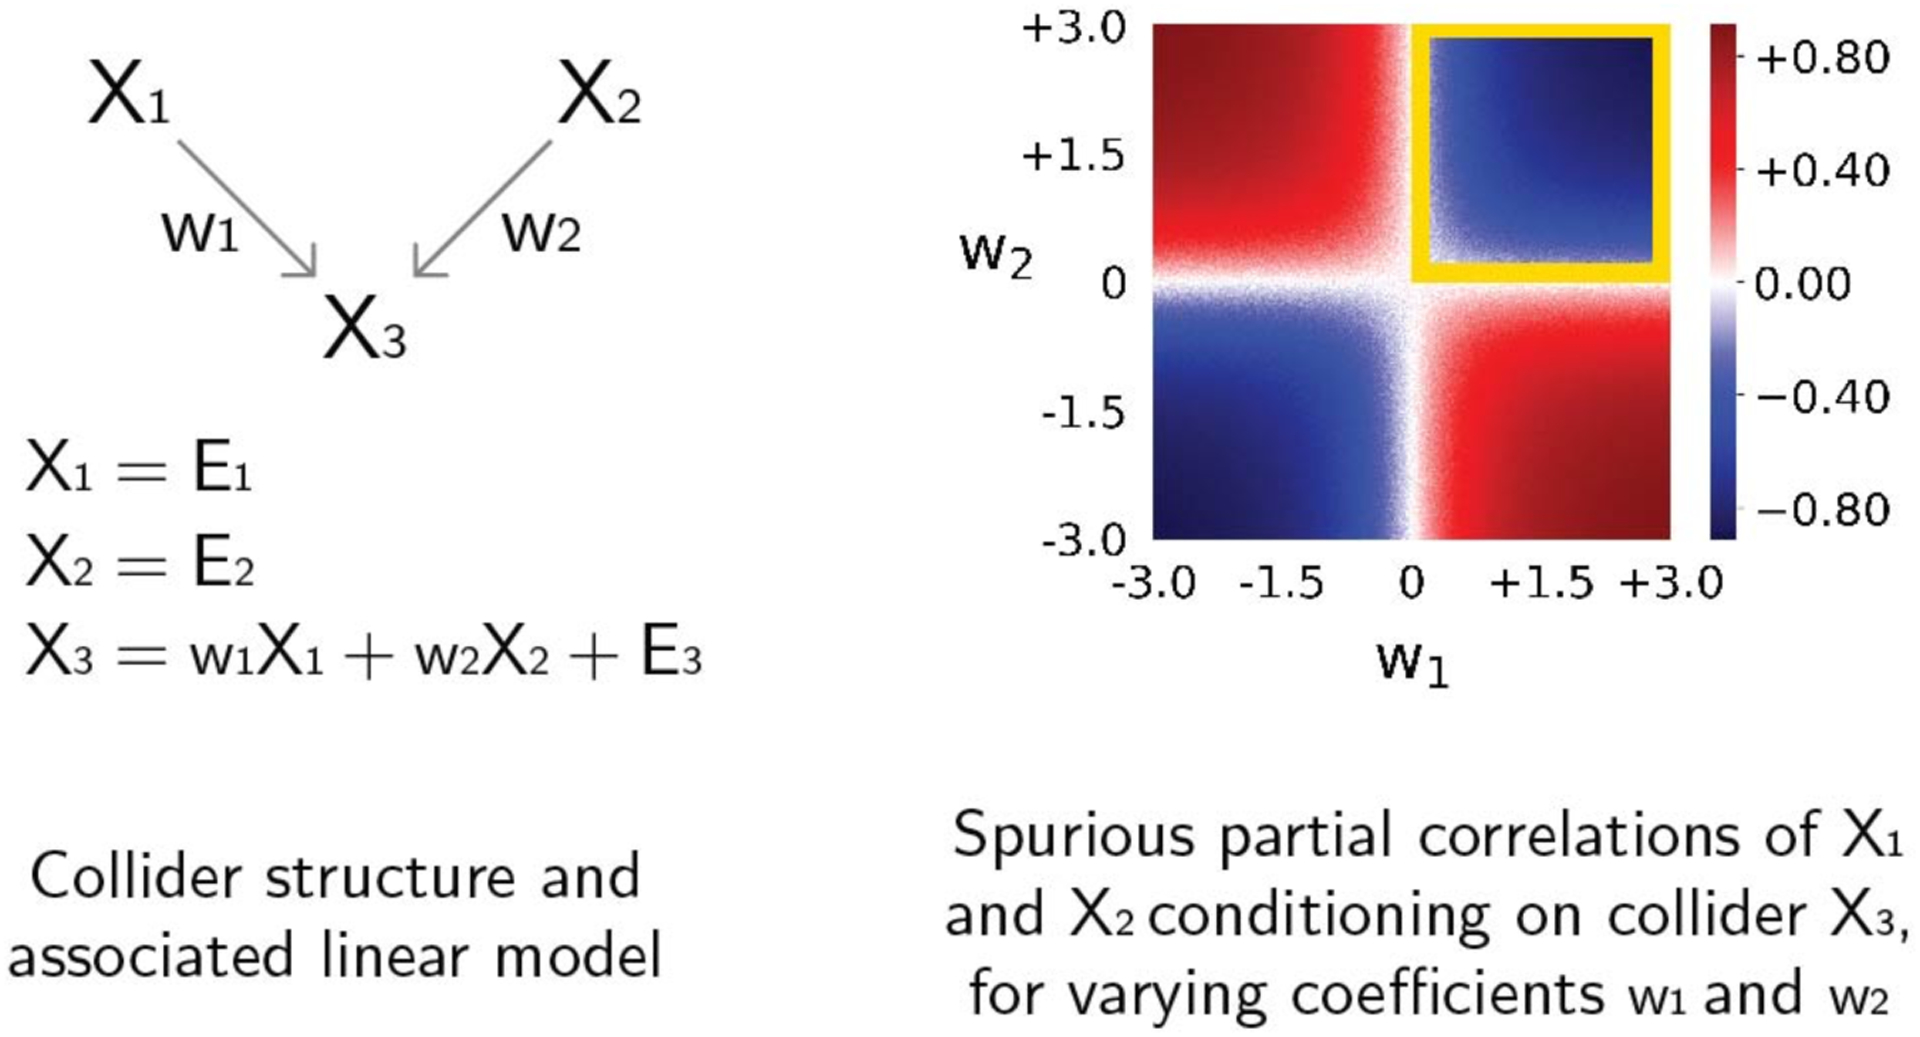
Figure 6. Positive or negative spurious partial correlations when conditioning on a collider.

The left panel shows a collider causal structure from regions X1 and X2 to X3 and an associated linear model with connectivity coefficients w1 and w2, and Gaussian noise terms E. We simulated data from this linear model for values of w1 and w2 from −3 to +3, and report in the right panel the resulting spurious partial correlations of X1 and X2 conditioning on X3 for combinations of values of w1 (x-axis) and w2 (y-axis). When both connectivity coefficients have positive values the resulting spurious partial correlation will be negative (blue region indicated by a yellow square). Negative spurious partial correlations are also observed if both connectivity coefficients are negative. In contrast, when the connectivity coefficients have opposite sign, the resulting spurious partial correlation will be positive (red regions).
