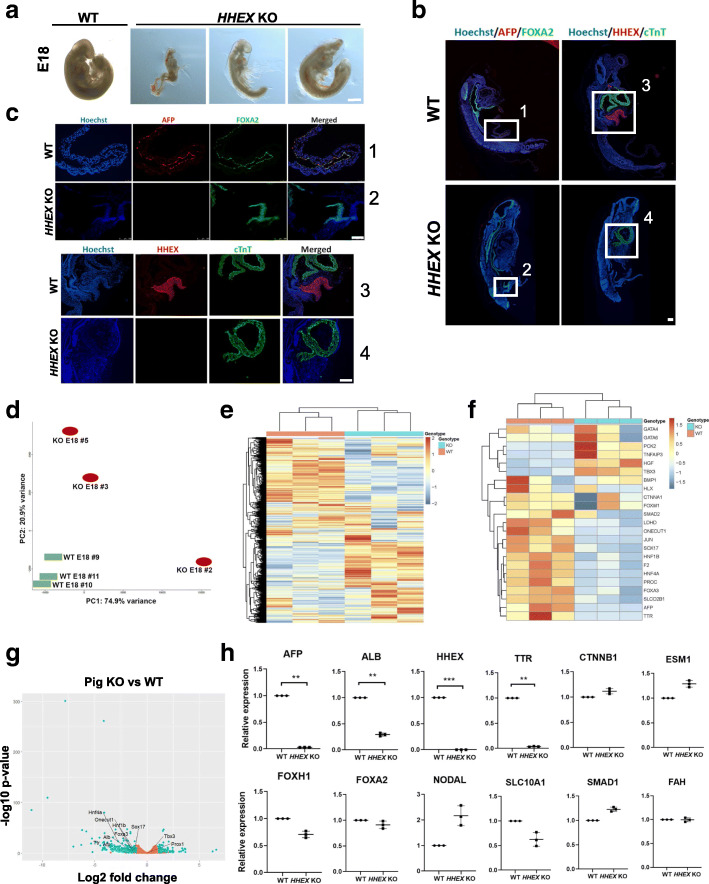
Fig. 2.
Characterization of the HHEX KO pig embryos compared to WT. a Phenotype of the HHEX KO E18 pigs. b, c IHC images of E18 HHEX KO pig embryos with Hoechst (blue), anti-AFP/HHEX (red), and anti-FOXA2/cTnT (green) antibodies. White insets in b correspond to numbered enlarged images in c. Bars: all are 100 μm, except for the bar in a, which is 500 μm. d–h Gene expression analyses (RNA-seq, d–g; qRT-PC, h) in the HHEX KO E18 pigs vs WT (N = 3 each group). d Principal component analysis. e Heatmap showing all the significantly up- and downregulated genes. f Heatmap showing liver-related genes whose expressions are significantly up- or downregulated. g Volcano plot showing significantly up- and downregulated genes (both in blue) and unaffected genes (orange), highlighting some liver-related genes. h Relative expression of transcripts. **p < 0.01; **p < 0.001

