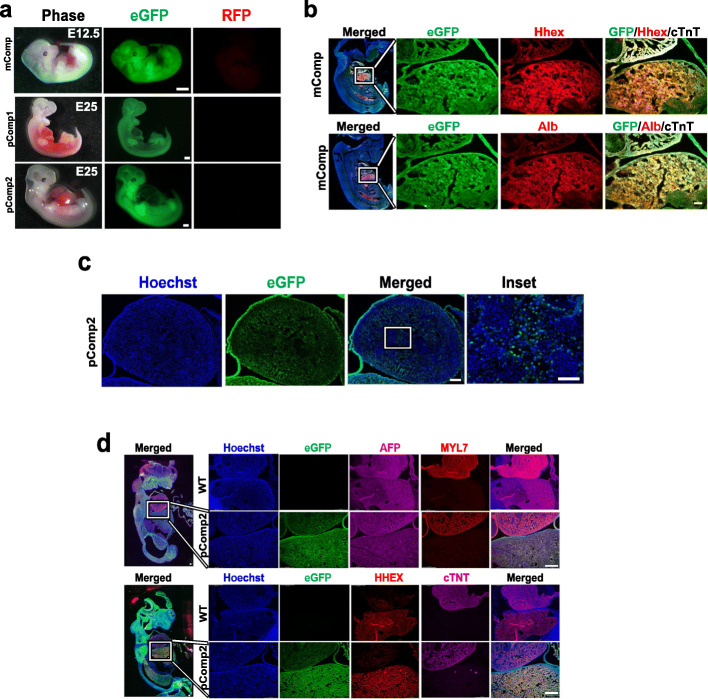
Fig. 4.
Mouse and pig complemented embryos. a Whole embryo images showing eGFP expression (RFP channel shown to indicate absence of signal and no autofluoresence). b, d IHC images of the mouse (b) and pig (d) complemented embryos showing the liver-heart area in the insets in the magnifications. c Heart area of one of the complemented pig embryos with the inset highlighting presence of both eGFP+ and eGFP− cells within the tissue. eGFP, enhanced green fluorescent protein; RFP, red fluorescent protein; mComp, mouse complemented embryo; pComp1, pig complemented embryo 1; pComp2, pic complemented embryo 2; MYL7, myosin light chain 7; cTNT, cardiac troponin T (white signal in mouse); ALB, albumin. Bars, 1 mm in a, 100 μm b and d whole embryos, and in b magnifications; 500 μm in d magnifications and in c, except for its inset, which is 250 μm

