Figure 4.

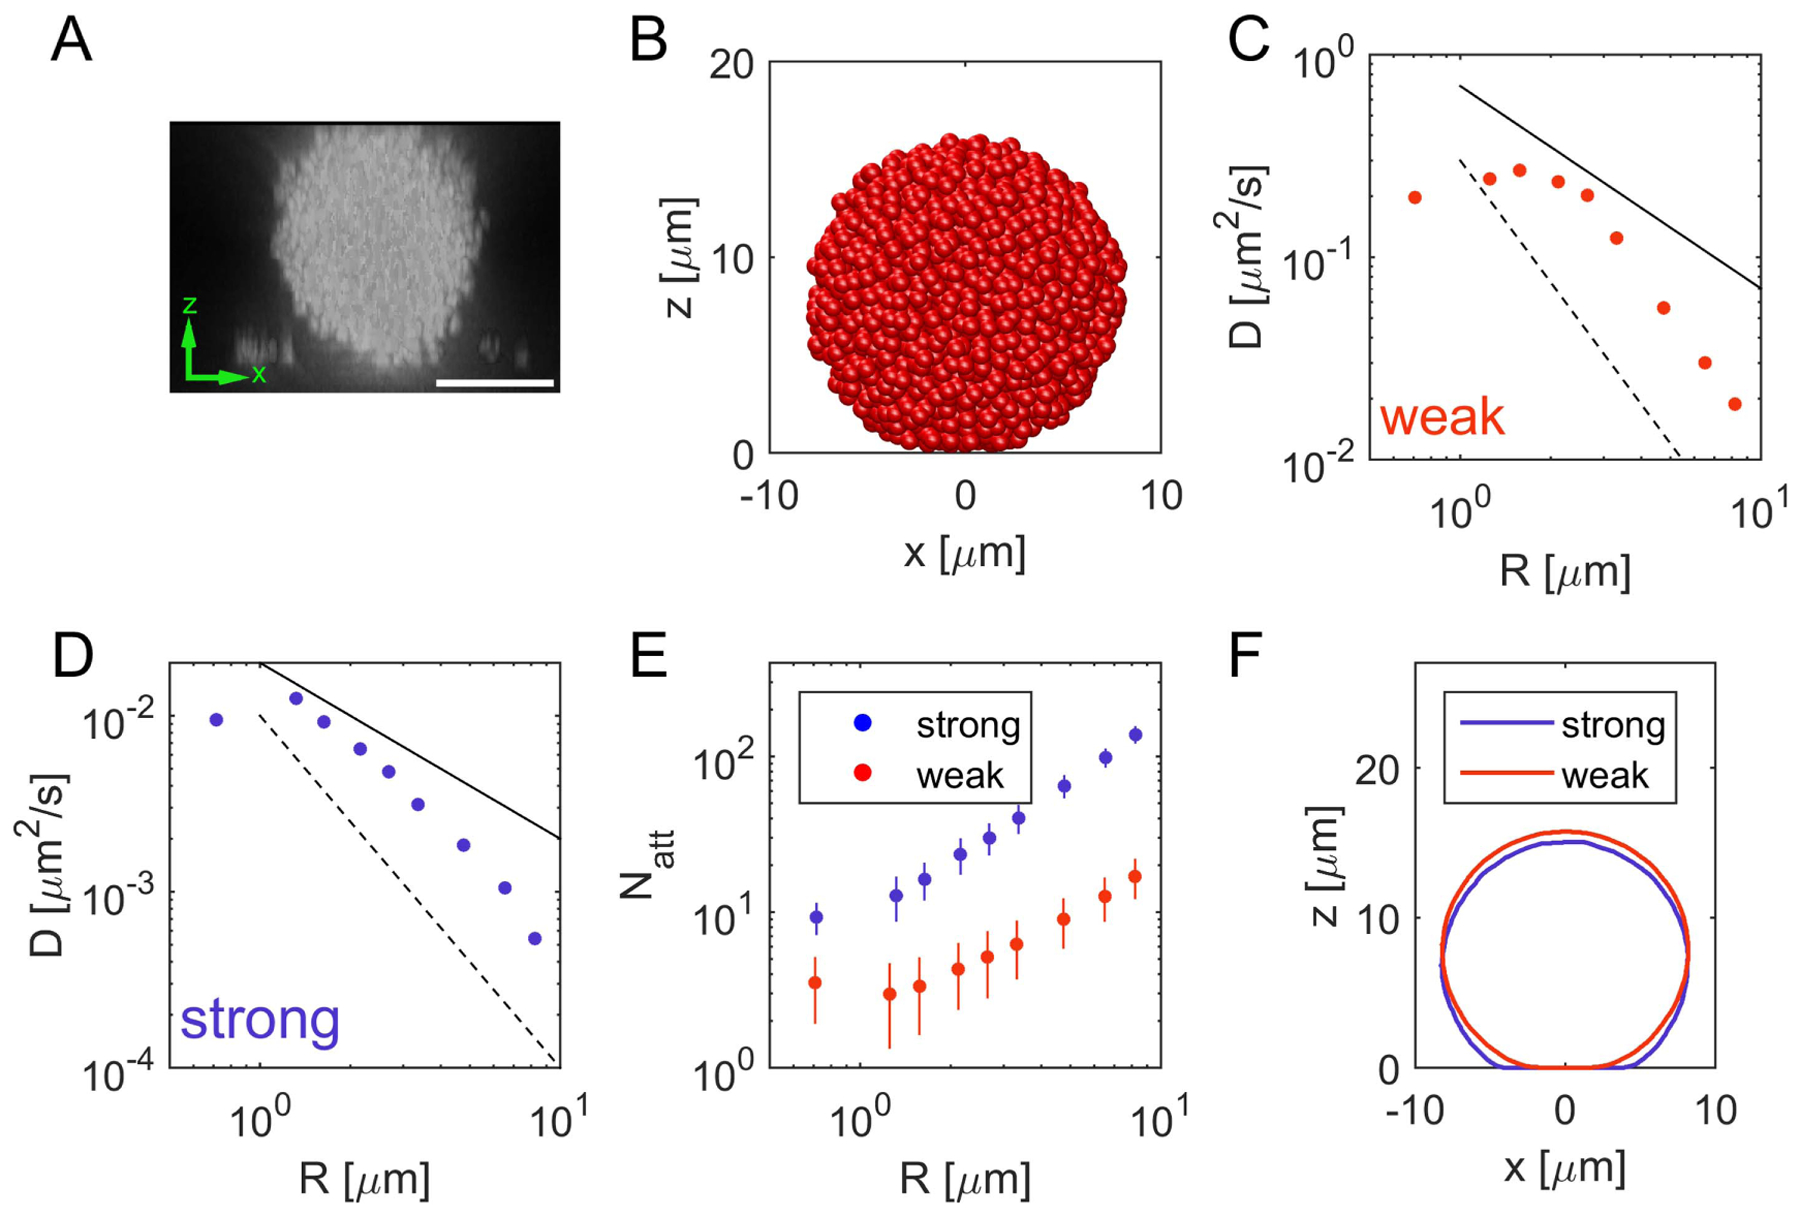
Properties of microcolonies on a surface. We only consider strong pili–pili-interactions (see table 3) and analyze the properties for strong and weak substrate interactions (see table 4). (A) Microscopic image of the three-dimensional shape of a fixed N. gonorrhoeae microcolony on a substrate from confocal microscope images (scale bar = 10 μm). (B) Image of a in silico microcolony on a surface, defined by z = 0 for weak pili-substrate interactions. (C), (D) Diffusion coefficient as a function of the colony radius for weak (C) and strong (D) substrate interactions. The solid black line represents a power law with exponent −1 (Stokes-Einstein-relation [41]), whereas the dashed line corresponds to a power law with the exponent −2. Combined with our result that a reduced number of pili increases the motility of single cells, the initial increase of the diffusion coefficient rises due to the binary nature of pili–pili interactions in the model. Pili–pili-bundles reduce the number of available pili-substrate interactions. (E) Number of pili attached to the substrate as a function of the colony radius. The larger the colony, the more pili are attached to the substrate. (F) Shape of an individual colony consisting of 1600 cells on a surface (please refer to supplementary information section S5.2 for details). For stronger pili-substrate interactions the colony increases its contact area to the surface.
